rateNames = ["Overall error rate", "Sensitivity (true positive rate)",
             "Specificity (true negative rate)",
             "False positive rate (1 - specificity)"]
rateStyles = ({
  "Overall error rate": {stroke: "black", dash: "none"},
  "Sensitivity (true positive rate)": {stroke: "#D55E00", dash: "8,4"},
  "Specificity (true negative rate)": {stroke: "#0072B2", dash: "2,4"},
  "False positive rate (1 - specificity)": {stroke: "#009E73", dash: "12,4,2,4"}
})
viewof shownRates = Inputs.checkbox(rateNames, {
  value: rateNames.slice(0, 3),
  format: name => html`<span style="display: inline-flex; align-items: center; gap: 0.4em">
    <svg width="36" height="10"><line x1="2" y1="5" x2="34" y2="5"
      stroke="${rateStyles[name].stroke}" stroke-width="2.5"
      stroke-dasharray="${rateStyles[name].dash}" stroke-linecap="round"/></svg>${name}</span>`
})Classifier Evaluation
Today
- Credit card classifiers
- Confusion matrix
- Sensitivity and specificity
- Threshold choice
- ROC curve
- AUC
- Student strata
Credit Card Classifiers
Credit card default data
ISLR2::Default · Who defaults? Which mistakes? Separate models for students?
| Default | Customers | Proportion | Mean balance ($) | SD of balance ($) | Zero balances |
|---|---|---|---|---|---|
| No | 9,667 | 0.9667 | 804 | 456 | 499 |
| Yes | 333 | 0.0333 | 1,748 | 341 | 0 |
Income and balance
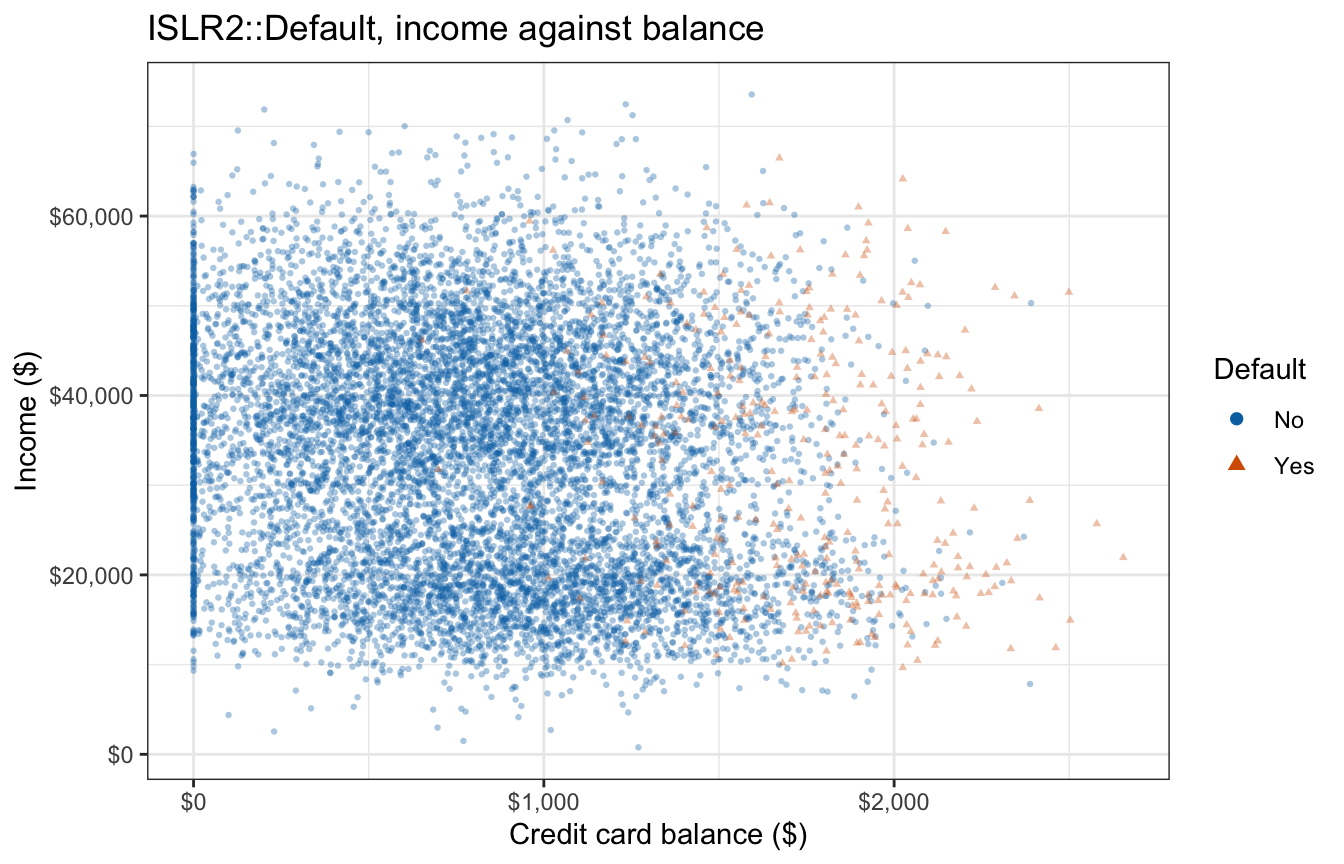
Defaulters at larger balances; the classes overlap heavily
Fitted classifiers
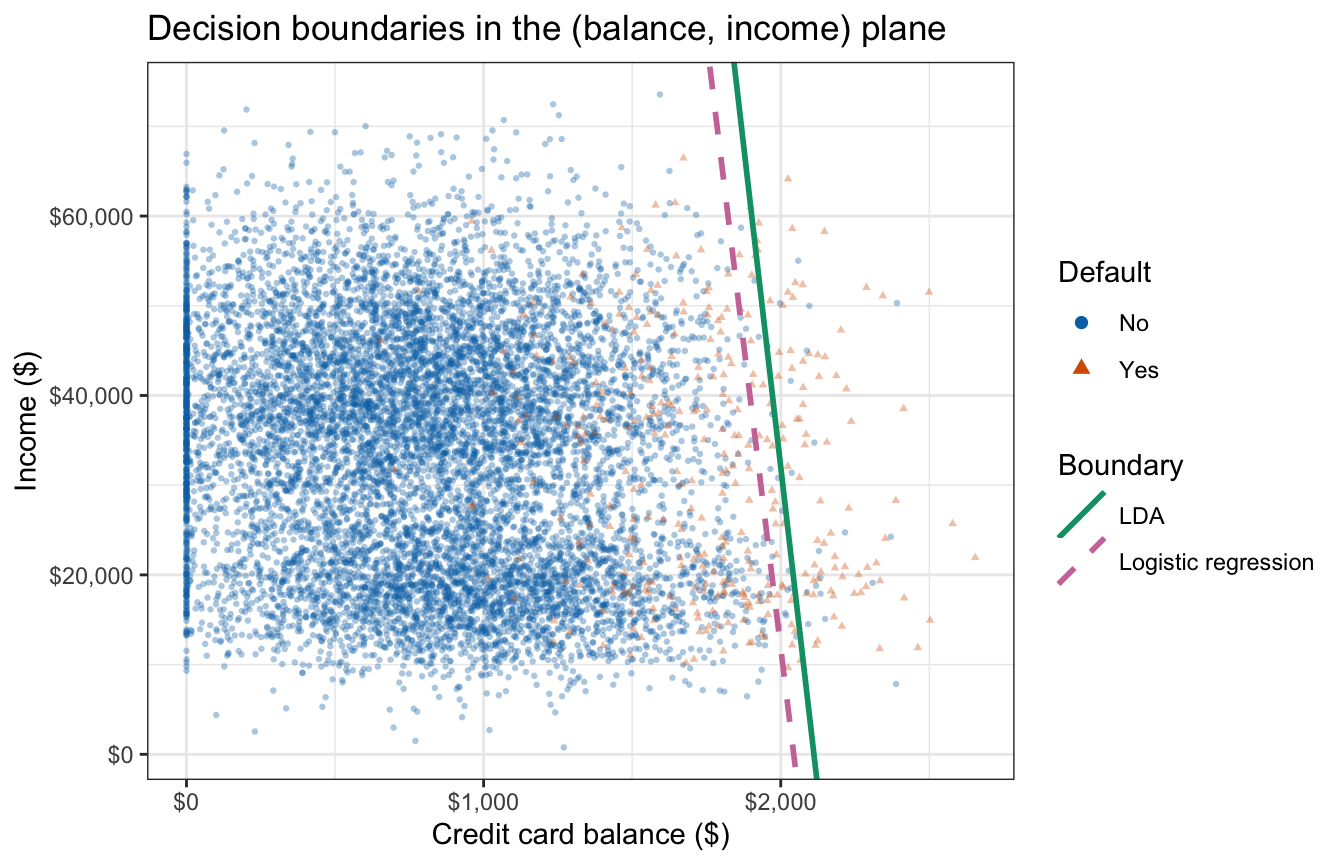
LDA (solid) and logistic regression (dashed): boundaries at \(\widehat p(x) = 0.5\)
Classifier Evaluation
LDA scores within each class
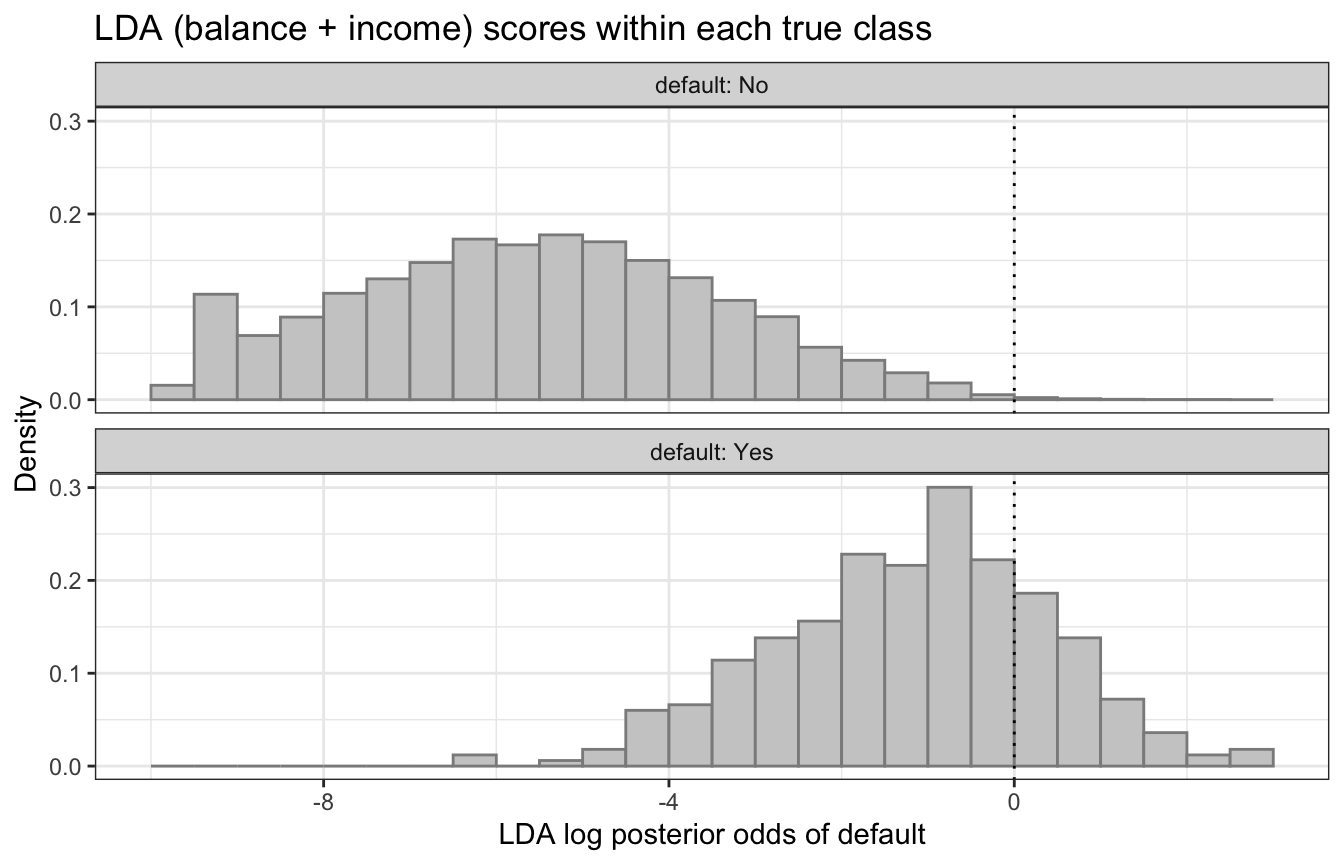
Dotted line: \(\widehat p(x) = 0.5\) · any threshold in the overlap makes two kinds of mistake
Confusion matrix
| Truth | Predicted positive | Predicted negative |
|---|---|---|
| Positive | True positive (TP) | False negative (FN) |
| Negative | False positive (FP) | True negative (TN) |
Positive: the class of interest · predict positive when \(\widehat p(x) > t\)
Error rate: \((FP + FN)/n\)
Credit card confusion matrix
| Truth | Predicted Yes | Predicted No | Total |
|---|---|---|---|
| Yes | 77 | 256 | 333 |
| No | 20 | 9,647 | 9,667 |
LDA, balance and income · \(t = 0.5\) · training counts
Error rate 2.76%, against 3.33% for predicting No for everyone
256 of the 276 errors are missed defaulters
Sensitivity and specificity
\[\text{Sensitivity} = \frac{TP}{TP + FN}, \qquad \text{Specificity} = \frac{TN}{TN + FP}\]
Sensitivity: positives caught, the true positive rate
Specificity: negatives left alone, the true negative rate
Credit card: sensitivity 23.1%, specificity 99.8%
Classification Threshold
Classification threshold
Lowering \(t\): sensitivity rises or stays, specificity falls or stays · no threshold improves both
{
  const rates = transpose(threshold_rates);
  return Plot.plot({
    width: 740, height: 500, style: {fontSize: "18px"},
    marginTop: 24,
    x: {domain: [0, 0.5], label: "Threshold t"},
    y: {domain: [0, 1], label: "Rate", grid: true},
    marks: [
      Plot.ruleX(threshold_marks, {stroke: "gray", strokeDasharray: "2,3"}),
      Plot.text(threshold_marks, {x: d => d, y: 1, text: d => `t = ${d}`,
                                  dy: -12, fill: "gray"}),
      ...rateNames.filter(r => shownRates.includes(r)).map(r =>
        Plot.line(rates.filter(d => d.rate === r),
                  {x: "t", y: "value", stroke: rateStyles[r].stroke,
                   strokeDasharray: rateStyles[r].dash, strokeWidth: 2.5,
                   strokeLinecap: "round"}))
    ]
  });
}Lowering the threshold
| Model | Threshold | TP | FN | FP | TN | Error rate | Sensitivity | Specificity |
|---|---|---|---|---|---|---|---|---|
| LDA, balance | 0.5 | 76 | 257 | 24 | 9,643 | 0.0281 | 0.2282 | 0.9975 |
| LDA, balance | 0.2 | 195 | 138 | 236 | 9,431 | 0.0374 | 0.5856 | 0.9756 |
| LDA, balance + income | 0.5 | 77 | 256 | 20 | 9,647 | 0.0276 | 0.2312 | 0.9979 |
| LDA, balance + income | 0.2 | 189 | 144 | 240 | 9,427 | 0.0384 | 0.5676 | 0.9752 |
| Logistic regression, balance + income | 0.5 | 108 | 225 | 38 | 9,629 | 0.0263 | 0.3243 | 0.9961 |
| Logistic regression, balance + income | 0.2 | 200 | 133 | 271 | 9,396 | 0.0404 | 0.6006 | 0.9720 |
Lower \(t\): more defaulters caught, more false alarms
ROC curve
ROC curve: sensitivity against \(1 - \text{specificity}\) at every threshold
Only the ordering of the observations matters
\[\widehat{p}(x) > t\]
Predict positive: \(t\) is therefore a threshold for a probability
\[c = \log\left[\frac{t}{1 - t}\right]\]
ROC curve, threshold slider
{
  const bins = transpose(slider_bins);
  const outline = transpose(slider_outline);
  const thresholds = transpose(slider_thresholds);
  const roc = transpose(slider_roc);
  const now = thresholds[Math.round(t * 100) - 1];
  const classes = ["No (negative)", "Yes (positive)"];
  const flagged = k => bins
    .filter(d => d.class === k && d.x1 > now.cutoff)
    .map(d => ({...d, x0: Math.max(d.x0, now.cutoff)}));

  const densityPlot = Plot.plot({
    width: 700, height: 400, style: {fontSize: "16px"},
    x: {label: "LDA log posterior odds of default"},
    y: {label: "Density within class"},
    color: {domain: classes, range: slider_colors, legend: true},
    marks: [
      Plot.rect(flagged(classes[0]),
                {x1: "x0", x2: "x1", y1: 0, y2: "density", fill: "class",
                 fillOpacity: 0.2}),
      Plot.rect(flagged(classes[1]),
                {x1: "x0", x2: "x1", y1: 0, y2: "density", fill: "class",
                 fillOpacity: 0.45}),
      Plot.line(outline.filter(d => d.class === classes[0]),
                {x: "x", y: "density", stroke: "class", strokeWidth: 2}),
      Plot.line(outline.filter(d => d.class === classes[1]),
                {x: "x", y: "density", stroke: "class", strokeDasharray: "6,4",
                 strokeWidth: 2}),
      Plot.ruleX([now.cutoff], {strokeDasharray: "2,3"})
    ]
  });

  const rocPlot = Plot.plot({
    width: 420, height: 400, style: {fontSize: "16px"},
    x: {domain: [0, 1], label: "False positive rate (1 − specificity)"},
    y: {domain: [0, 1], label: "True positive rate (sensitivity)"},
    marks: [
      Plot.line([[0, 0], [1, 1]], {stroke: "gray", strokeDasharray: "4,4"}),
      Plot.line(roc, {x: "fpr", y: "tpr", strokeWidth: 2}),
      Plot.dot([now], {x: "fpr", y: "tpr", r: 6, fill: "white", stroke: "black",
                       strokeWidth: 2})
    ]
  });

  return html`<p style="text-align: center"><b>t = ${t.toFixed(2)}</b>,
    cutoff c = ${now.cutoff.toFixed(2)}; sensitivity = ${now.tpr.toFixed(3)},
    specificity = ${(1 - now.fpr).toFixed(3)}</p>
    <div style="display: flex; flex-wrap: wrap; gap: 1rem; justify-content: center">
      ${densityPlot}${rocPlot}
    </div>`;
}
Lower \(t\): the cutoff slides left, the point climbs toward \((1, 1)\)
ROC curves, balance + income
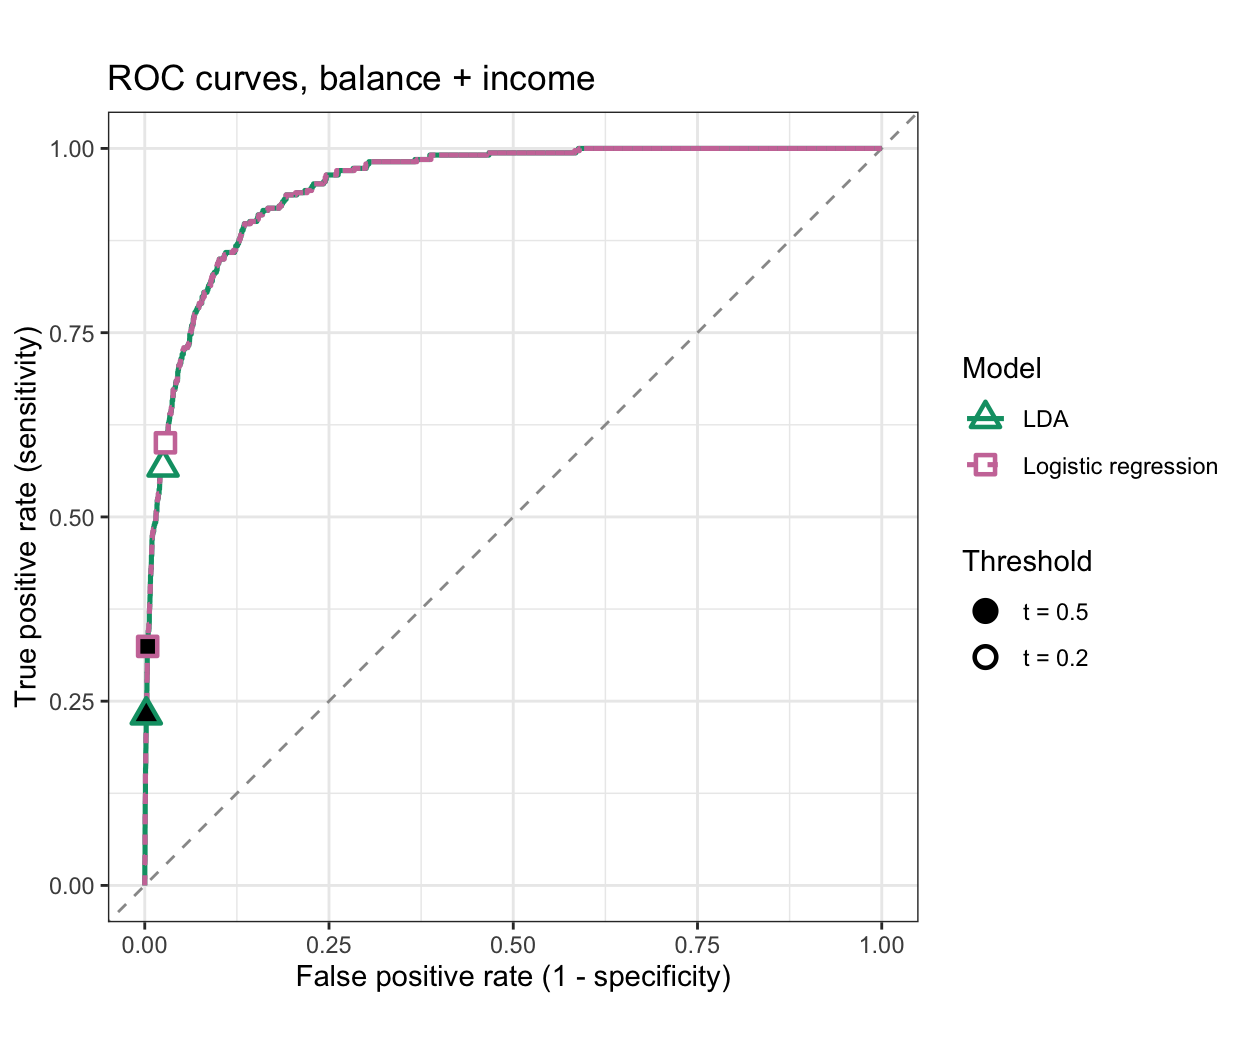
Almost on top of one another, far above the diagonal
Area under the ROC curve
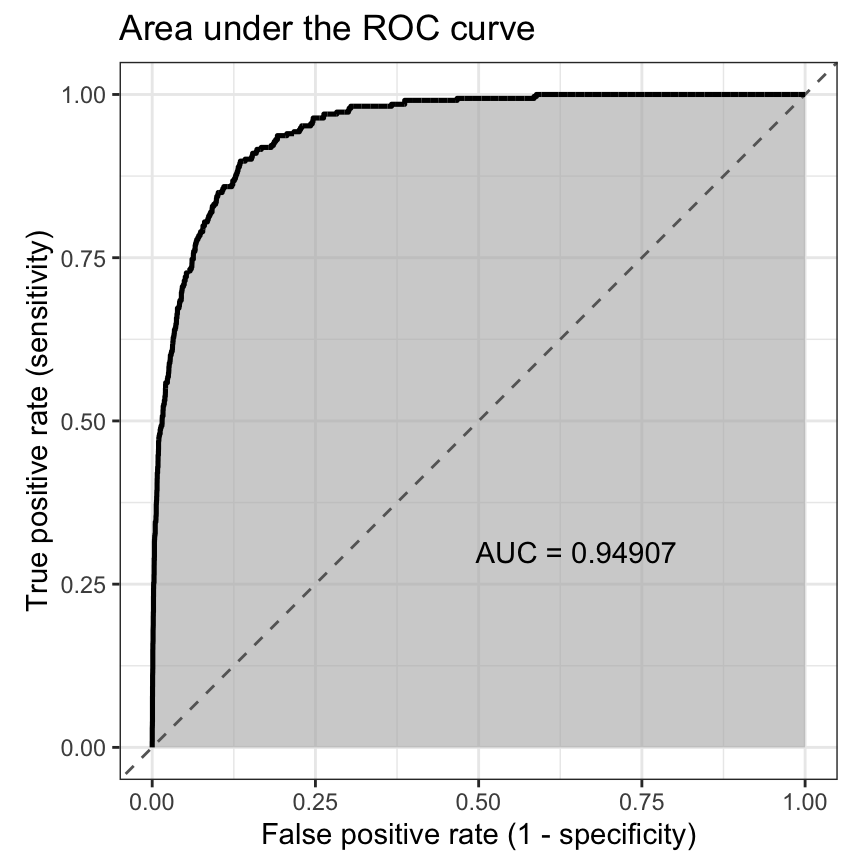
AUC = 0.94907 for balance and income
Computing the AUC
\[\text{AUC} = \sum_{m=1}^{M}\left(\text{FPR}_m - \text{FPR}_{m-1}\right)\frac{\text{TPR}_m + \text{TPR}_{m-1}}{2}\]
- \(\left(\text{FPR}_m, \text{TPR}_m\right)\) — point \(m\) on the ROC curve, by increasing \(\text{FPR}\)
- \(m = 0\) is \((0, 0)\); \(m = M\) is \((1, 1)\)
Trapezoid rule: join consecutive points by lines and add up the areas beneath
AUC of the fitted classifiers
| Model | AUC |
|---|---|
| LDA, balance | 0.94798 |
| Logistic regression, balance | 0.94798 |
| LDA, balance + income | 0.94907 |
| Logistic regression, balance + income | 0.94905 |
Generally, larger is better, at most 1
ROC curves, same customers
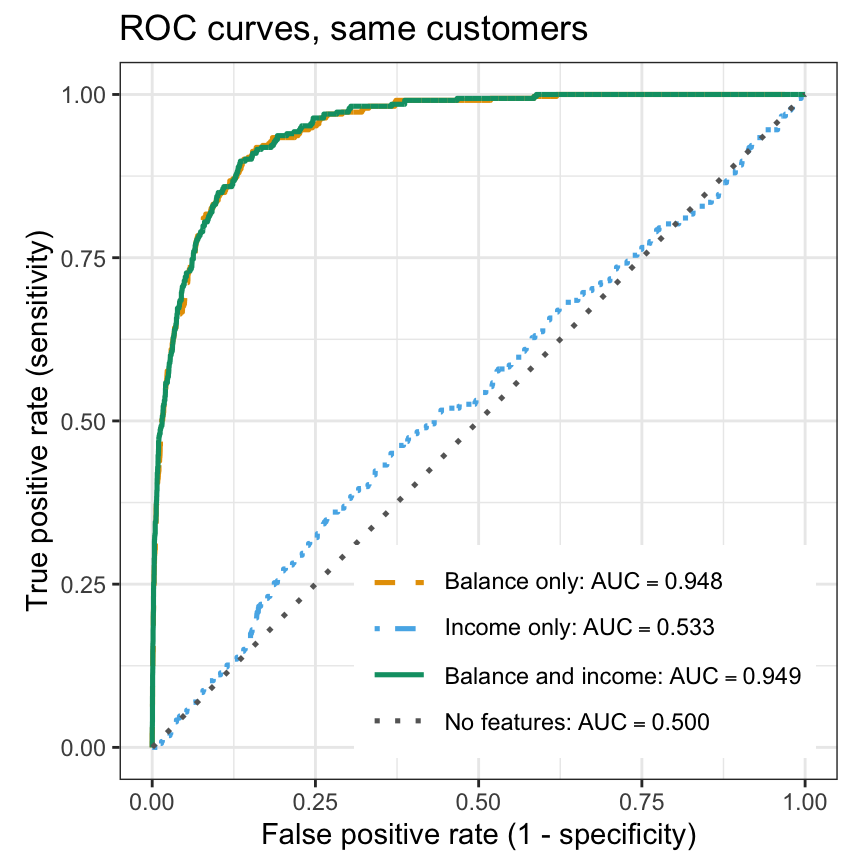
AUC ranks classifiers without a threshold
Student Strata
Default rate by student status
| Student | Customers | Defaulters | Default rate | Median income |
|---|---|---|---|---|
| No | 7,056 | 206 | 2.92% | $39,893 |
| Yes | 2,944 | 127 | 4.31% | $17,994 |
Students default more often and have much lower median income
Income and balance by student
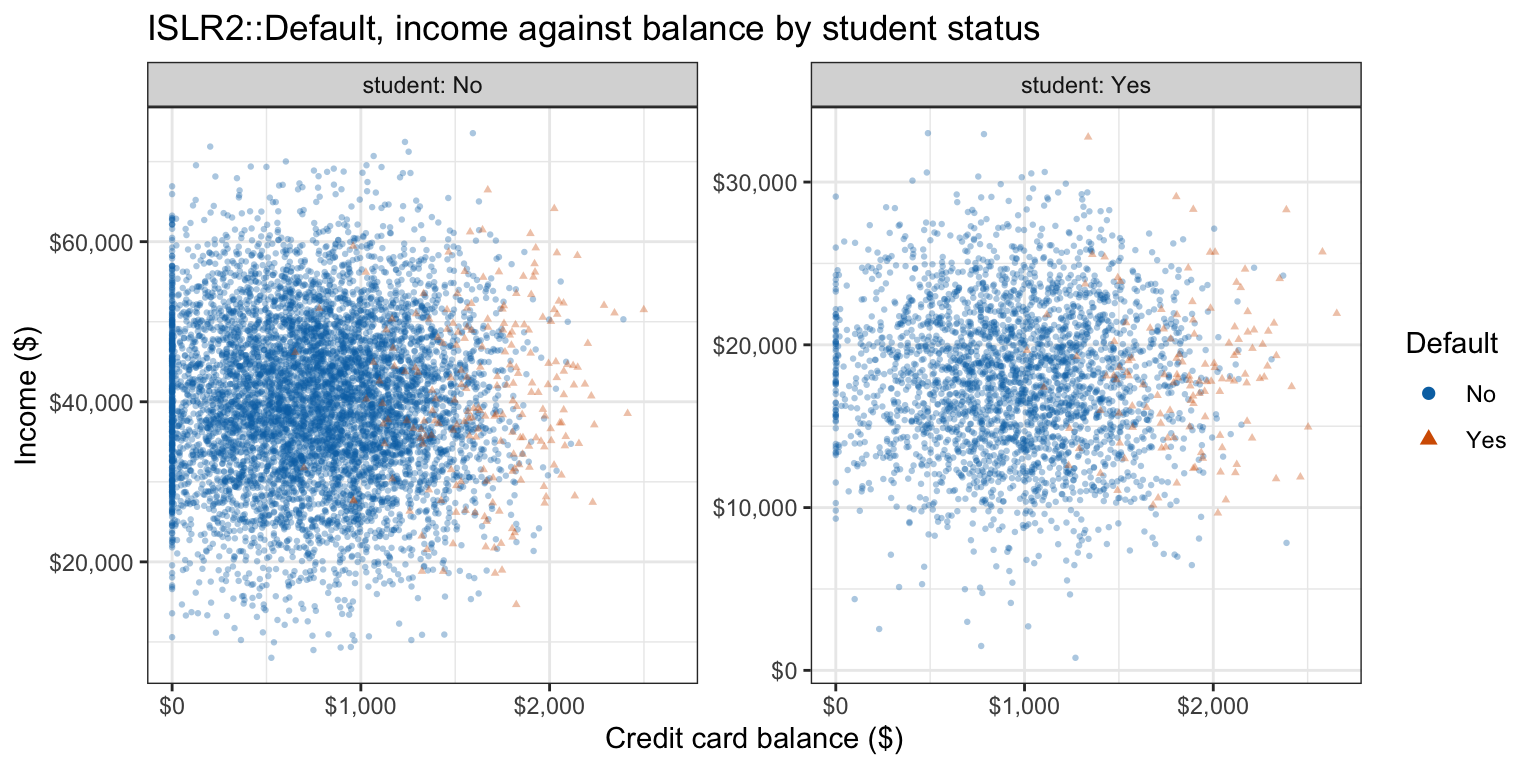
In both strata the defaulters sit at larger balances
Boundaries within each stratum
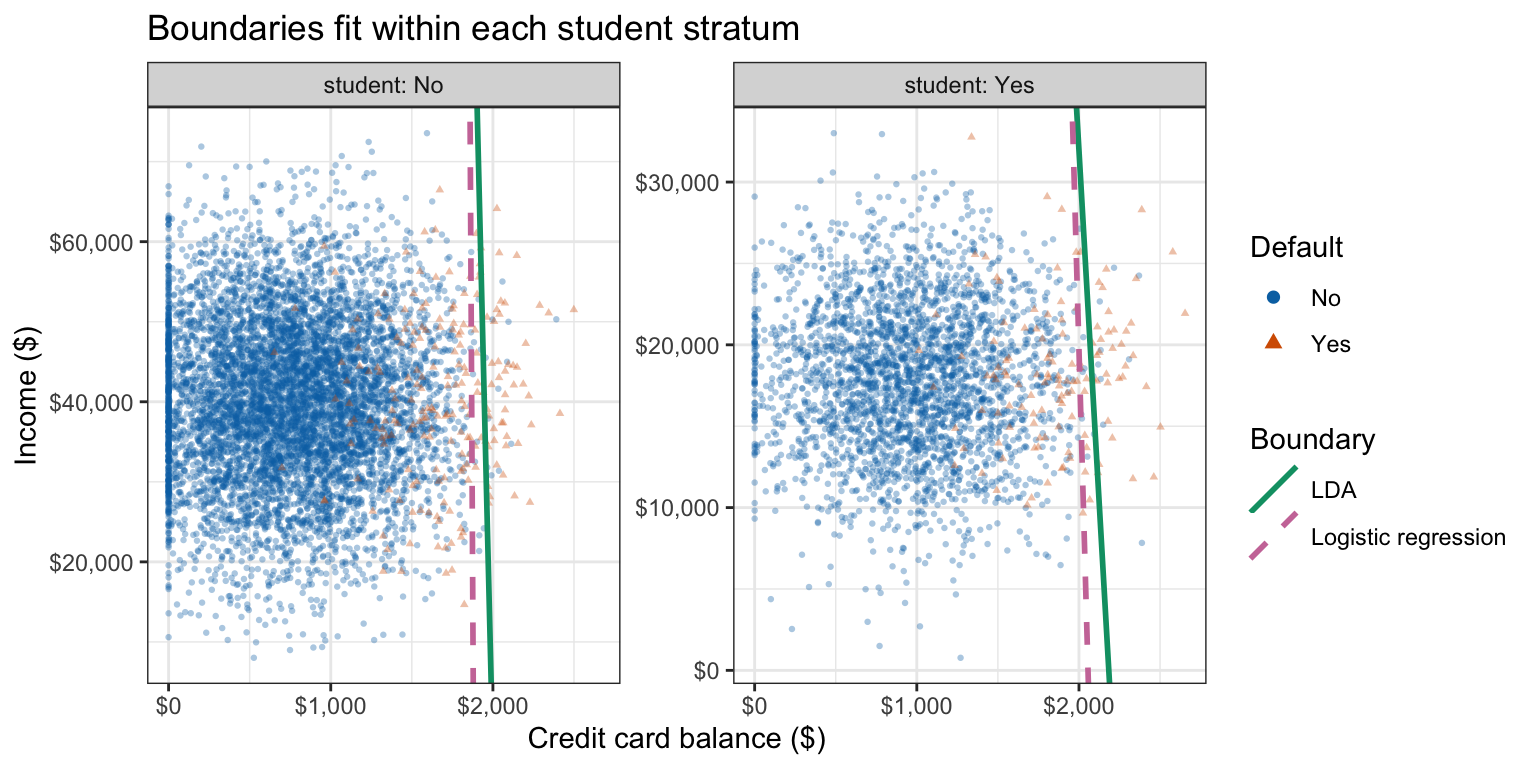
LDA fit within each stratum (solid), interacted logistic regression (dashed)
Stratified and single fits
| Model | Error rate at \(t = 0.5\) | AUC |
|---|---|---|
| LDA, single fit | 0.0276 | 0.94907 |
| LDA, by student stratum | 0.0273 | 0.94955 |
| Logistic regression, additive | 0.0263 | 0.94905 |
| Logistic regression, interacted with student | 0.0268 | 0.94958 |
Barely changes the classifications
Training rates: stratified models estimate twice as many parameters
Multiple classes
Confusion matrix
| Truth | Predicted 1 | Predicted 2 | \(\cdots\) | Predicted \(K\) |
|---|---|---|---|---|
| 1 | \(n_{11}\) | \(n_{12}\) | \(\cdots\) | \(n_{1K}\) |
| 2 | \(n_{21}\) | \(n_{22}\) | \(\cdots\) | \(n_{2K}\) |
| \(\vdots\) | \(\vdots\) | \(\vdots\) | \(\ddots\) | \(\vdots\) |
| \(K\) | \(n_{K1}\) | \(n_{K2}\) | \(\cdots\) | \(n_{KK}\) |
\(n_{kj}\) — true class \(k\), predicted class \(j\)
Error rate: \(1 - \sum_{k=1}^K n_{kk} / n\)
Multiple classes, one versus rest
\[\text{Sensitivity}_k = \frac{n_{kk}}{\sum_{j=1}^K n_{kj}}, \qquad \text{Specificity}_k = \frac{\sum_{l \ne k} \sum_{j \ne k} n_{lj}}{\sum_{l \ne k} \sum_{j=1}^K n_{lj}}\]
One versus the rest: class \(k\) positive, the other \(K - 1\) classes together negative
Conclusion
- Confusion matrix
- Sensitivity and specificity
- Threshold
- ROC curve
- AUC
- Stratified models
DS 3030