Quadratic Discriminant Analysis and Naive Bayes
Today
- QDA
- Naive Bayes
- KNN
- Comparing methods
Motivation
Credit card default data
ISLR2::Default · fit on a random half, test on the other half
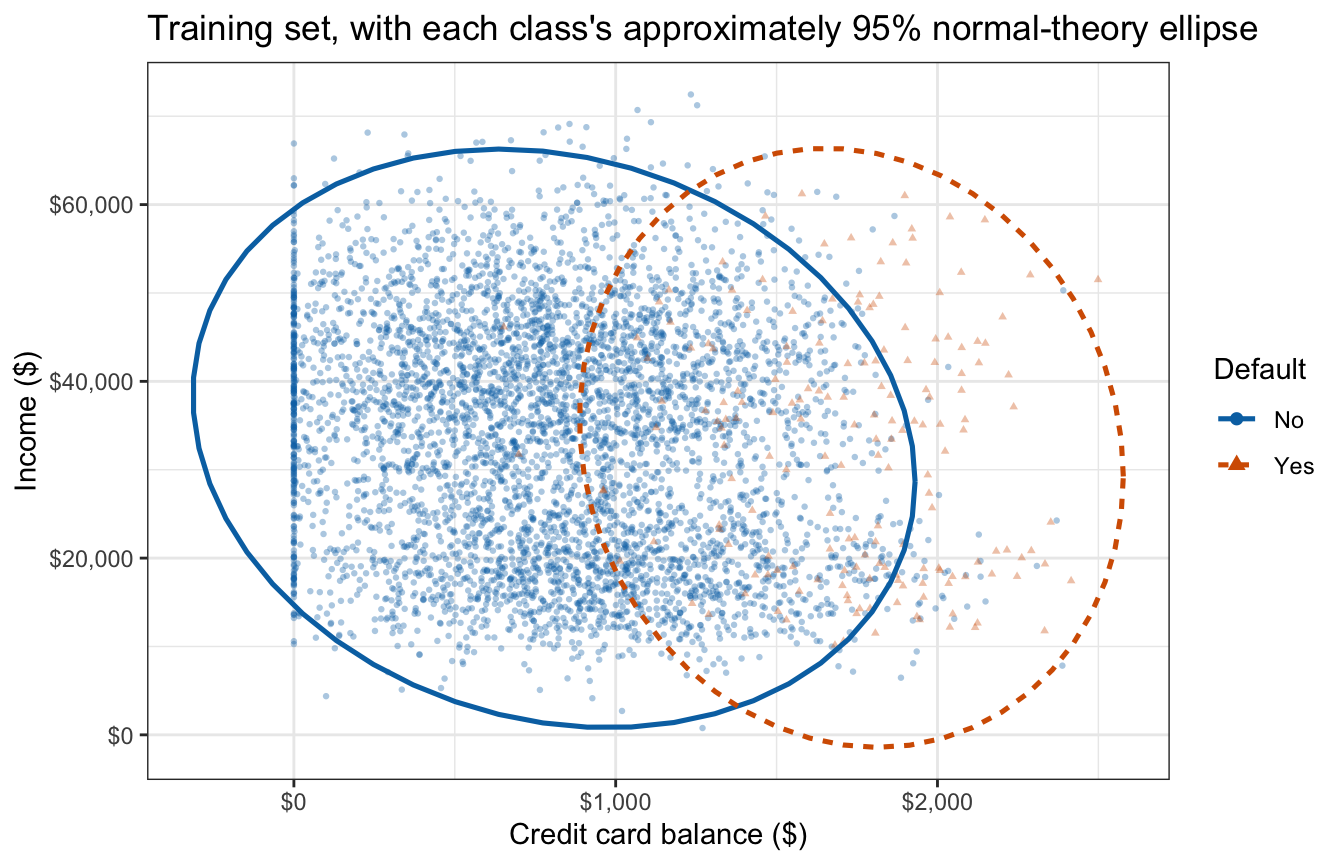
Training customers, each class’s 95% normal-theory ellipse
Generative classifiers
\[p_k(x) \propto \pi_k f_k(x)\]
\[Y_i \stackrel{ind}{\sim} \text{Categorical}\left(\pi_1, \ldots, \pi_K\right), \qquad i = 1, \ldots, n\]
Generative classifiers differ only in the model for \(f_k(x)\)
| Classifier | Distribution |
|---|---|
| LDA | \(X_i \mid Y_i = k \stackrel{ind}{\sim} N_p\left(\mu_k, \Sigma\right)\) |
| QDA | \(X_i \mid Y_i = k \stackrel{ind}{\sim} N_p\left(\mu_k, \Sigma_k\right)\) |
| Naive Bayes | \(X_{ij} \mid Y_i = k \stackrel{ind}{\sim} f_{kj}, \quad j = 1, \ldots, p\) |
| Gaussian naive Bayes | \(X_i \mid Y_i = k \stackrel{ind}{\sim} N_p\left(\mu_k, \Lambda_k\right)\) |
\(\Lambda_k\): diagonal covariance matrix
Quadratic Discriminant Analysis
Class-specific covariance matrices
\[Y_i \stackrel{ind}{\sim} \text{Categorical}\left(\pi_1, \ldots, \pi_K\right), \qquad X_i \mid Y_i = k \stackrel{ind}{\sim} N_p\left(\mu_k, \Sigma_k\right), \qquad i = 1, \ldots, n\]
Own \(\Sigma_k\) in every class
\[\widehat\Sigma_k = \frac{1}{n_k - 1}\sum_{i:\, y_i = k}\left(x_i - \widehat\mu_k\right)\left(x_i - \widehat\mu_k\right)^\top\]
Each \(\Sigma_k\) from its own class alone, divisor \(n_k - 1\); \(\widehat\pi_k\) and \(\widehat\mu_k\) as in LDA
Fitting QDA
Call:
qda(default ~ balance + income, data = train)

Prior probabilities of groups:
    No    Yes
0.9648 0.0352

Group means:
      balance   income
No   808.2541 33549.49
Yes 1732.5500 32482.56Fitted class contours
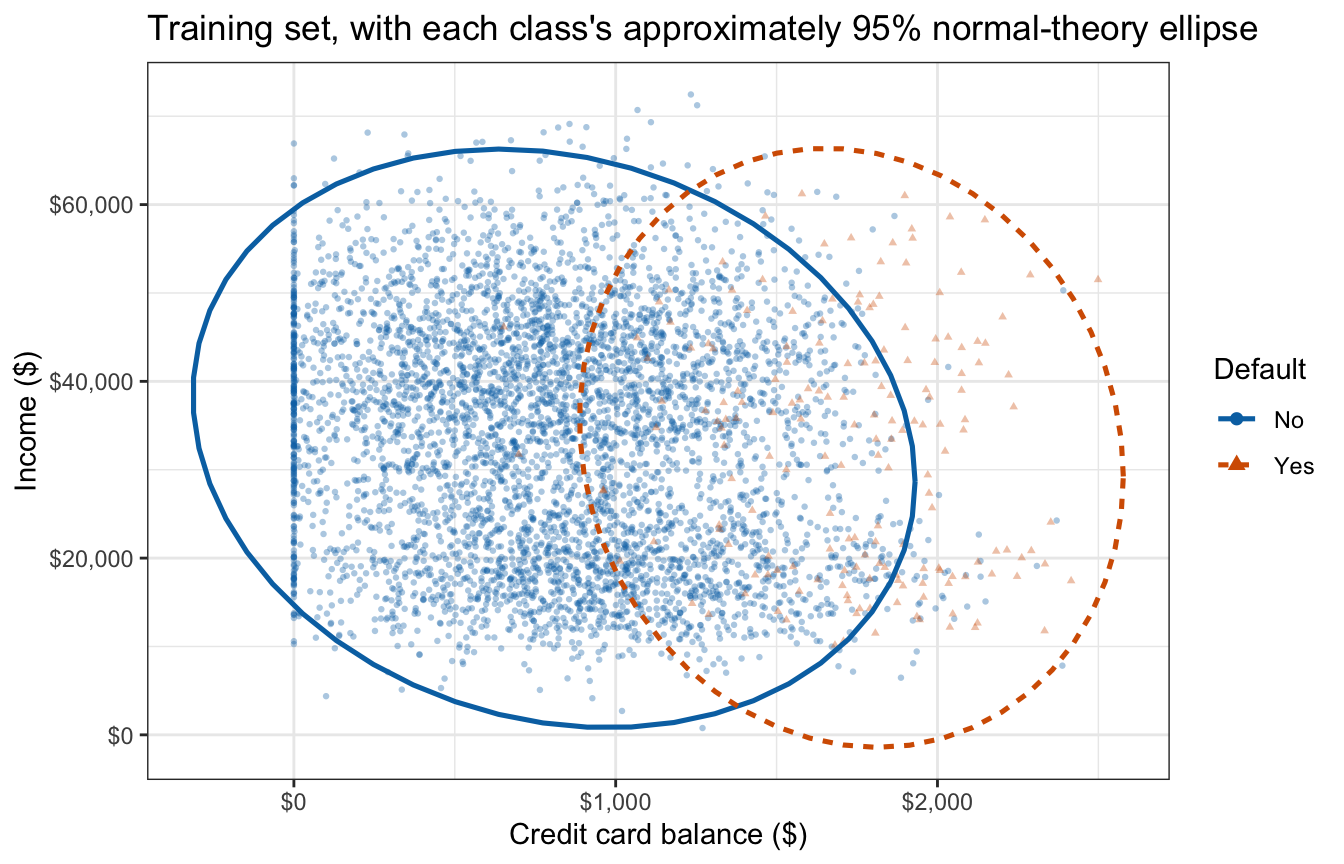
Each class’s ellipse: a contour of a Gaussian density with that class’s sample mean and covariance matrix
Quadratic discriminant
\[\log\left[\pi_k f_k(x)\right] = \log \pi_k - \frac{p}{2}\log(2\pi) - \frac{1}{2}\log\left|\Sigma_k\right| - \frac{1}{2}\left(x - \mu_k\right)^\top \Sigma_k^{-1}\left(x - \mu_k\right)\]
Dropping the terms that do not involve \(k\) gives the discriminant function
\[\delta_k(x) = -\frac{1}{2}x^\top \Sigma_k^{-1} x + x^\top \Sigma_k^{-1}\mu_k - \frac{1}{2}\mu_k^\top \Sigma_k^{-1}\mu_k - \frac{1}{2}\log\left|\Sigma_k\right| + \log \pi_k\]
Quadratic in \(x\)
Quadratic decision boundary
\[\begin{aligned} \log\left[\frac{p_2(x)}{1 - p_2(x)}\right] &= \delta_2(x) - \delta_1(x) \\ &= \beta_0 + x^\top\left(\Sigma_2^{-1}\mu_2 - \Sigma_1^{-1}\mu_1\right) - \frac{1}{2}x^\top \left(\Sigma_2^{-1} - \Sigma_1^{-1}\right) x \end{aligned}\]
Boundary: log posterior odds \(= 0\)
- Two features: a conic section
- One feature: up to two points
One feature
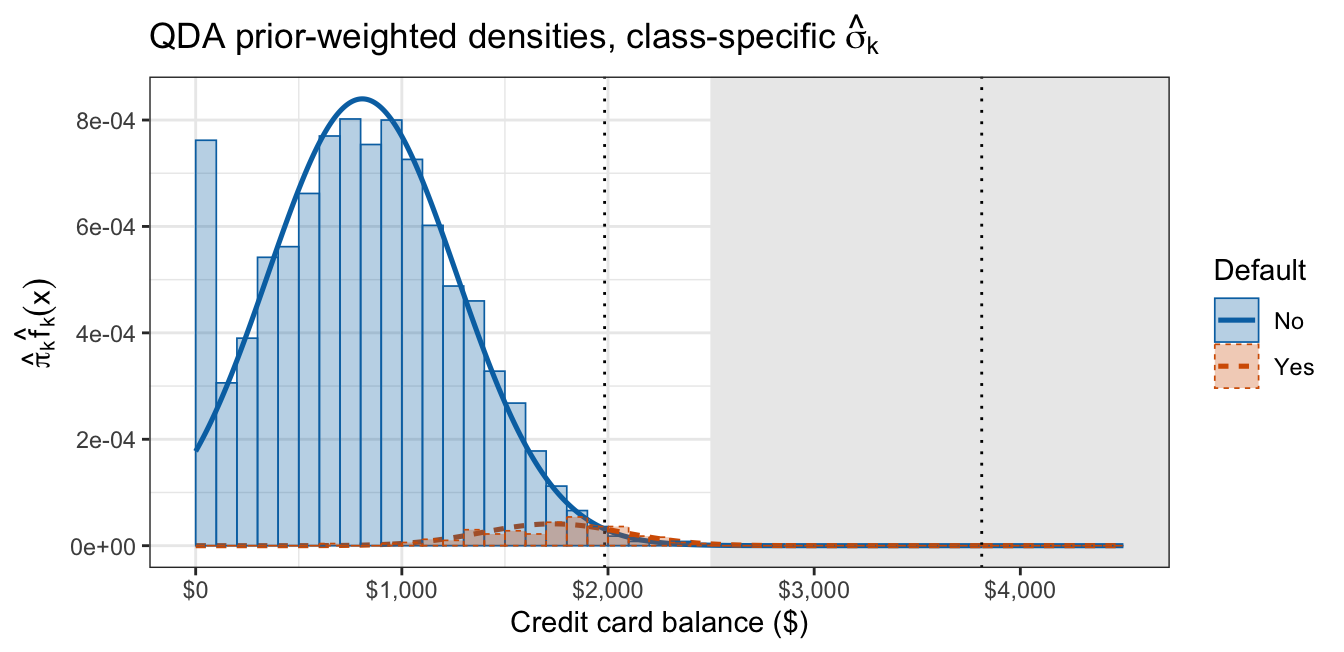
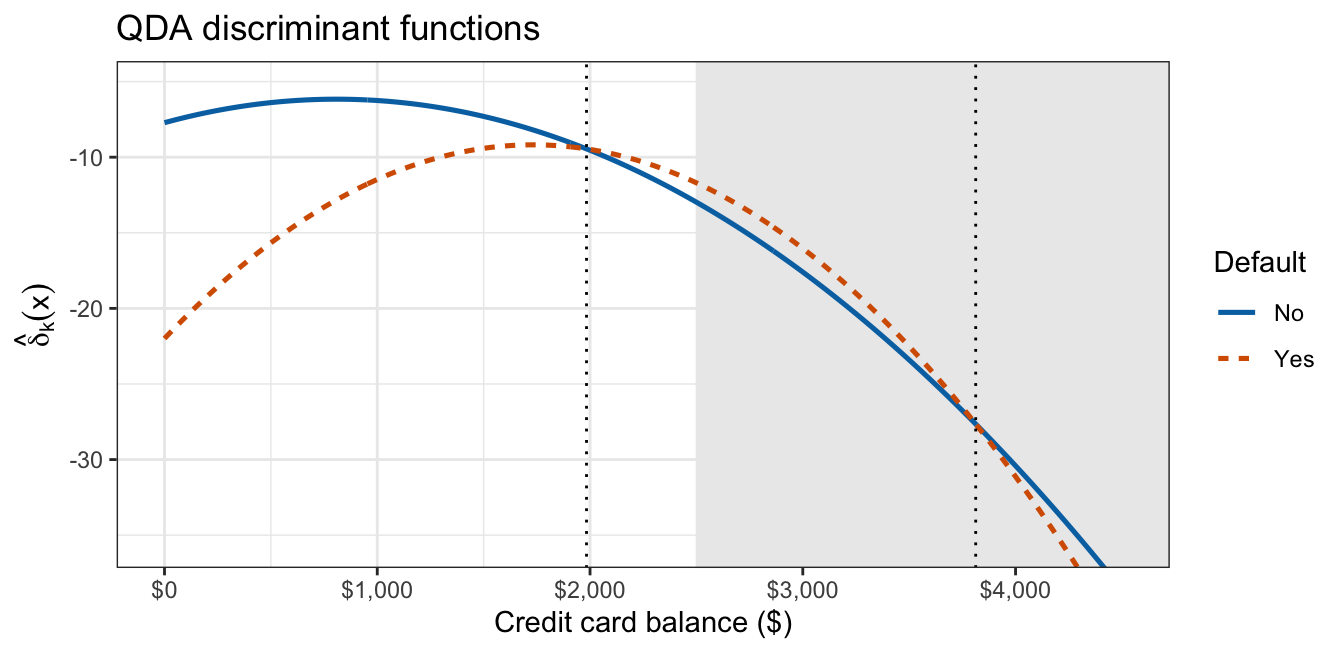
The class with the larger variance is assigned in both tails
Two features
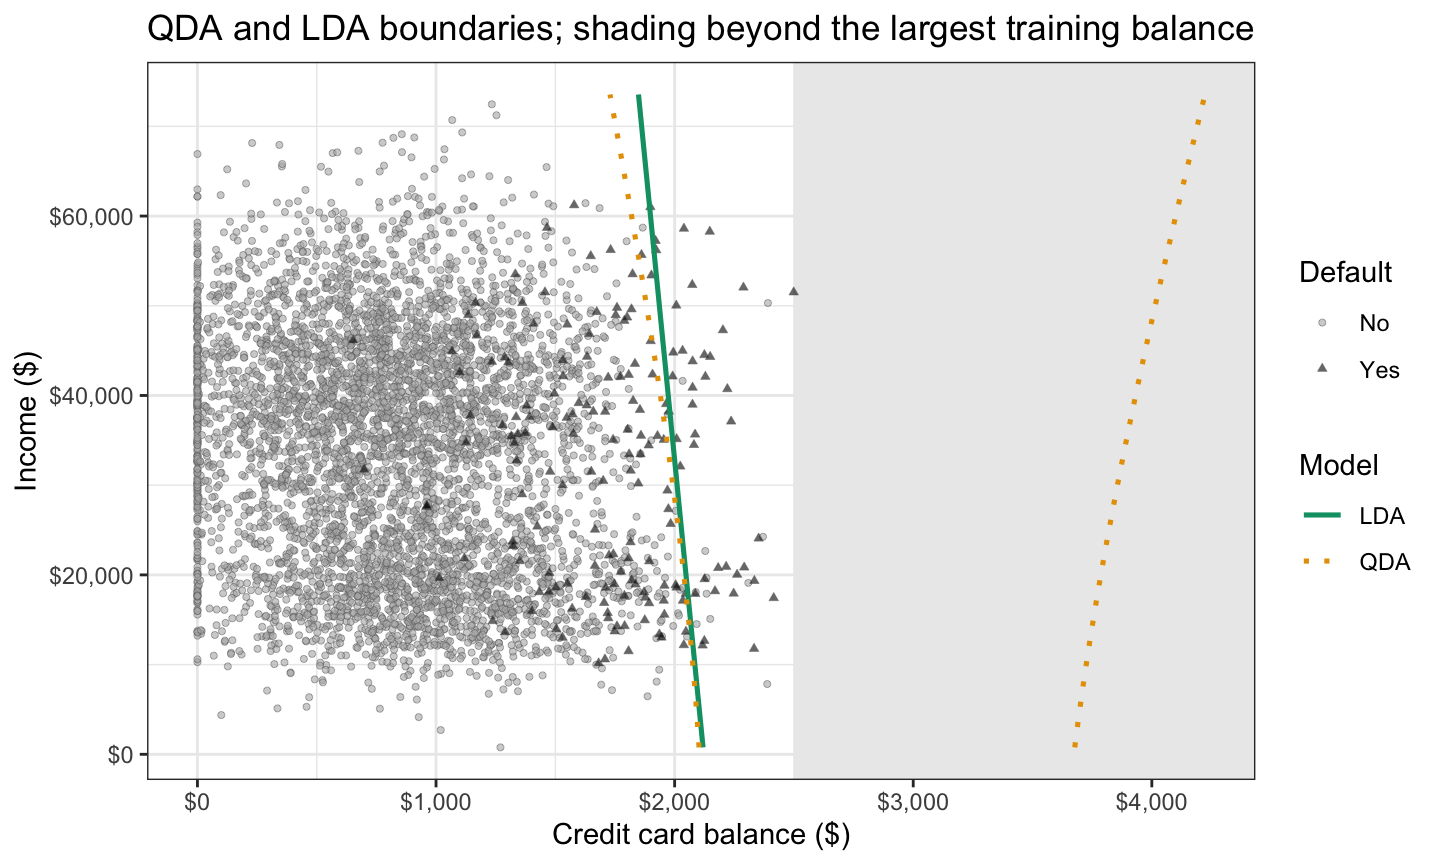
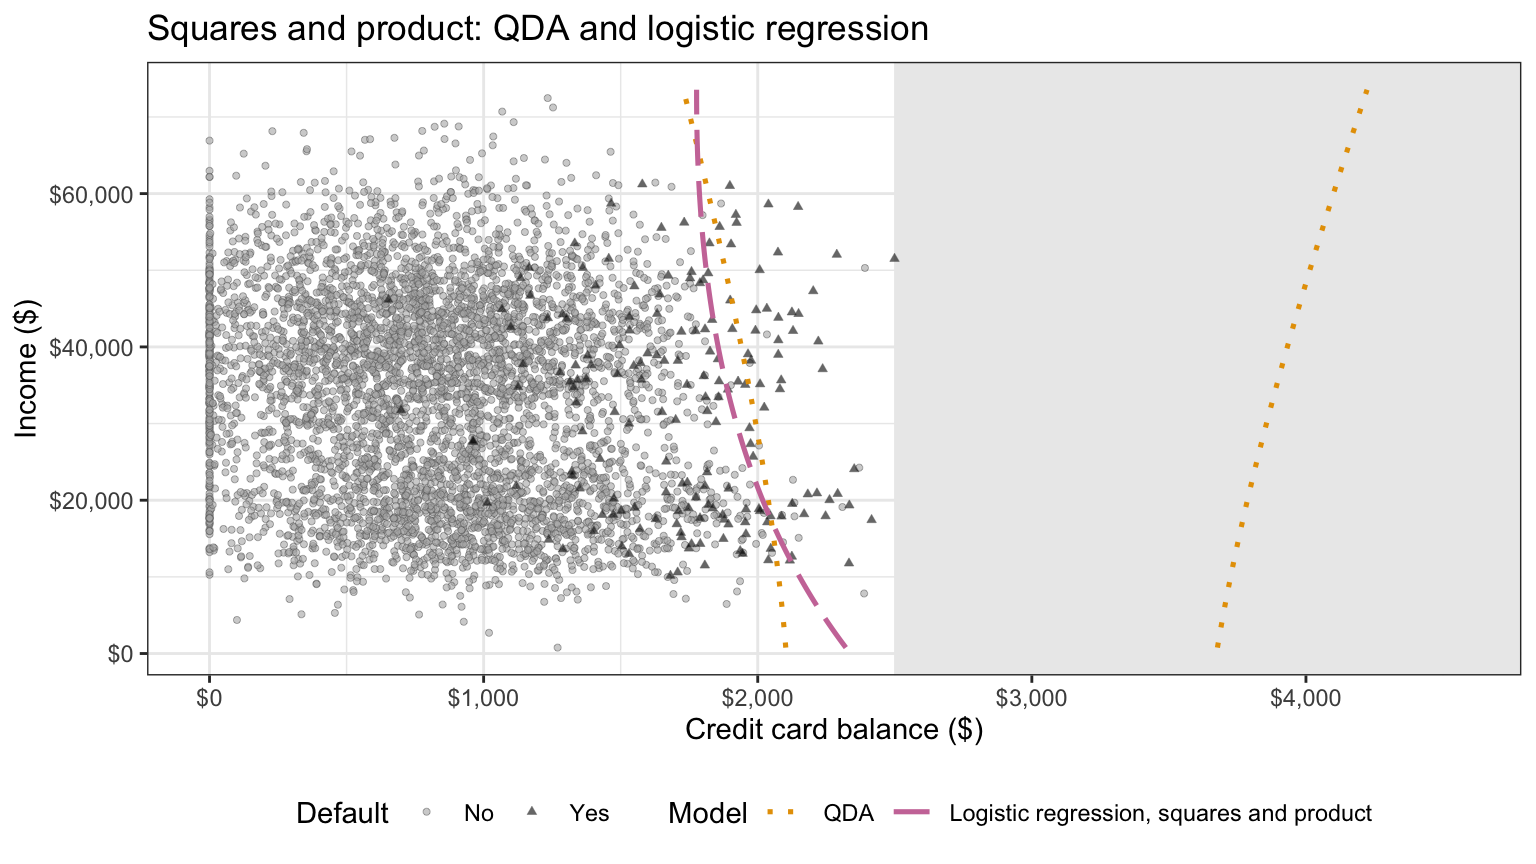
Within the training balances, QDA’s boundary runs close to LDA’s line; beyond them it has a second branch
Naive Bayes
Conditional independence
\[Y_i \stackrel{ind}{\sim} \text{Categorical}\left(\pi_1, \ldots, \pi_K\right), \qquad X_{ij} \mid Y_i = k \stackrel{ind}{\sim} f_{kj}, \qquad i = 1, \ldots, n, \quad j = 1, \ldots, p\]
\(\stackrel{ind}{\sim}\) — independent over observations \(i\) and features \(j\)
\[f_k(x) = f_{k1}(x_1) \times f_{k2}(x_2) \times \cdots \times f_{kp}(x_p) = \prod_{j=1}^p f_{kj}(x_j)\]
Each \(f_{kj}\) modeled and estimated on its own; features of different types, densities of different types
Mixed feature types
- Quantitative: Gaussian, \(X_{ij} \mid Y_i = k \stackrel{ind}{\sim} N\left(\mu_{kj}, \sigma_{kj}^2\right)\)
- Binary: Bernoulli, \(X_{ij} \mid Y_i = k \stackrel{ind}{\sim} \text{Bernoulli}\left(\theta_{kj}\right)\), with \(\theta_{kj} = P(X_{ij} = 1 \mid Y_i = k)\)
- Categorical: \(X_{ij} \mid Y_i = k \stackrel{ind}{\sim} \text{Categorical}\left(\theta_{kj1}, \ldots, \theta_{kjM_j}\right)\)
Fitting naive Bayes
Naive Bayes Classifier for Discrete Predictors

Call:
naiveBayes.default(x = X, y = Y, laplace = laplace)

A-priori probabilities:
Y
    No    Yes
0.9648 0.0352

Conditional probabilities:
     balance
Y          [,1]     [,2]
  No   808.2541 458.3208
  Yes 1732.5500 342.2770

     income
Y         [,1]     [,2]
  No  33549.49 13369.50
Yes 32482.56 13731.38Additive log posterior odds
\[\log\left[\frac{p_2(x)}{1 - p_2(x)}\right] = \log\frac{\pi_2}{\pi_1} + \sum_{j=1}^p \log\frac{f_{2j}(x_j)}{f_{1j}(x_j)}\]
Feature \(j\) contributes its own log ratio, \(\log\left(f_{2j}(x_j)/f_{1j}(x_j)\right)\), a function of \(x_j\) alone
Additive model, no interactions
Diagonal covariance
\[X_{ij} \mid Y_i = k \stackrel{ind}{\sim} N\left(\mu_{kj}, \sigma_{kj}^2\right)\]
Given \(Y_i = k\): a product of \(p\) independent normal densities
Equivalent to a multivariate normal with a diagonal covariance matrix
\[Y_i \stackrel{ind}{\sim} \text{Categorical}\left(\pi_1, \ldots, \pi_K\right), \qquad X_i \mid Y_i = k \stackrel{ind}{\sim} N_p\left(\mu_k, \Lambda_k\right), \qquad i = 1, \ldots, n\]
\[\Lambda_k = \text{diag}\left(\sigma_{k1}^2, \ldots, \sigma_{kp}^2\right)\]
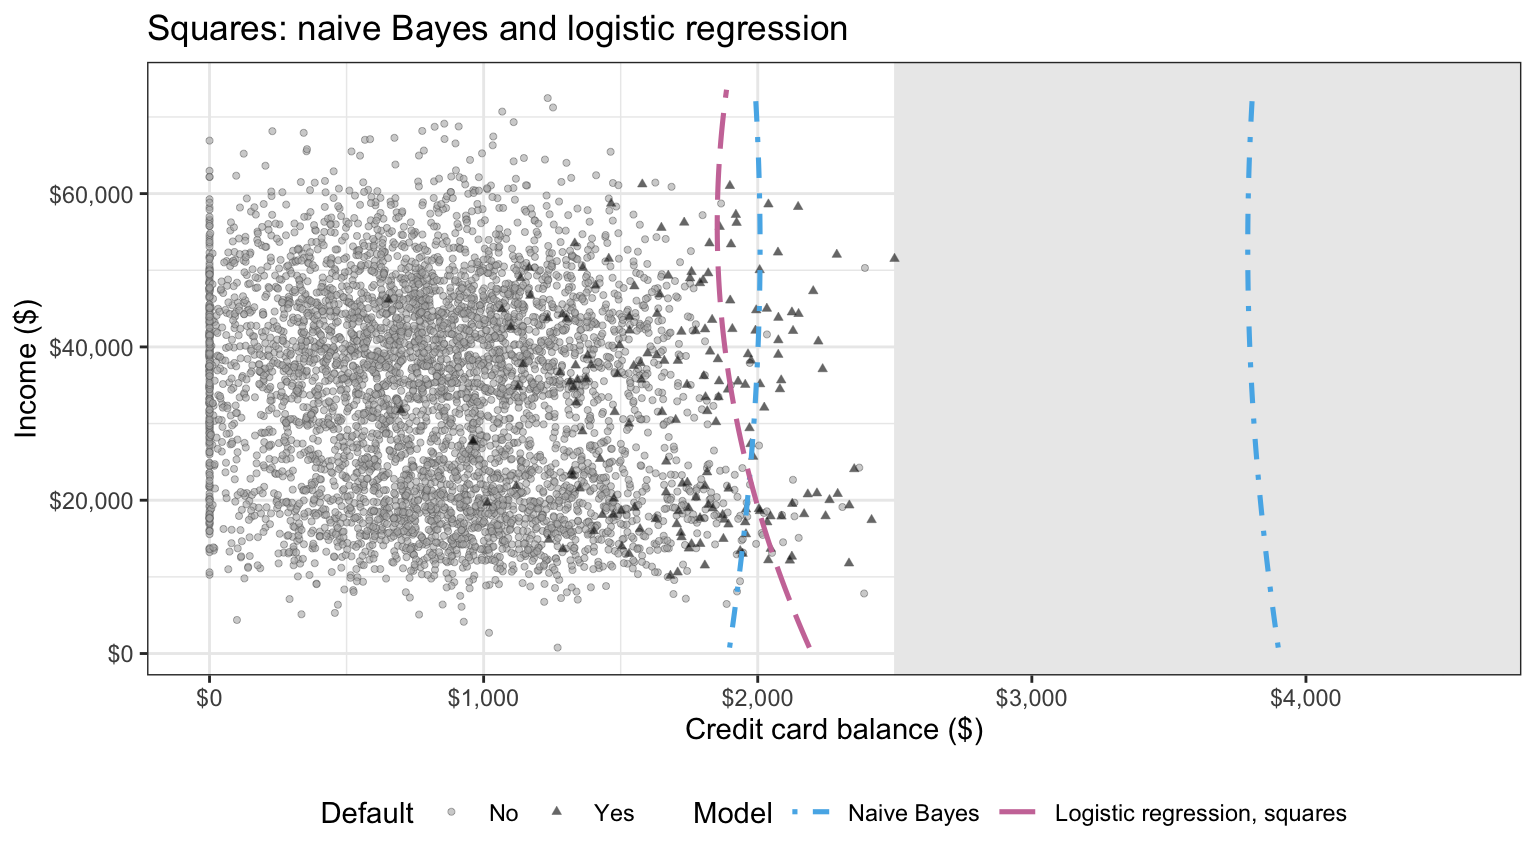
Gaussian naive Bayes is QDA with every \(\Sigma_k\) diagonal; shared variances, LDA with \(\Sigma\) diagonal
Naive Bayes boundary
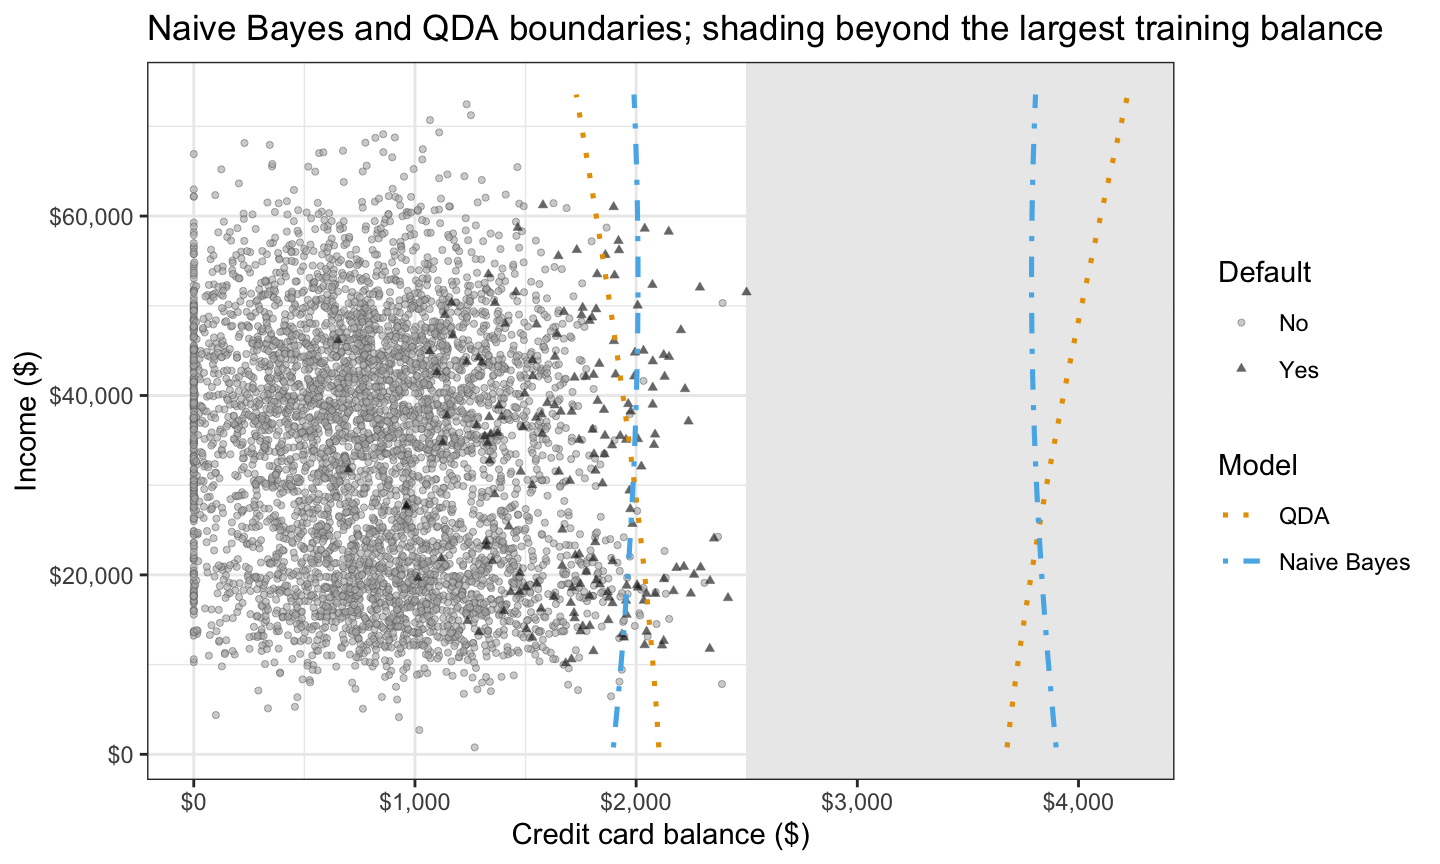
Naive Bayes and QDA boundaries: close, both with a second branch
K-Nearest Neighbors
KNN classification
\[\widehat p_k(x_0) = \frac{1}{K}\sum_{i \in \mathcal{N}_0}\mathrm{I}(y_i = k)\]
- \(x_0\) — feature vector to classify
- \(\mathcal{N}_0\) — the \(K\) training points closest to \(x_0\)
- \(K\) — number of neighbors (not the number of classes)
Neighbors vote!
Assign \(x_0\) to the class with the largest \(\widehat p_k(x_0)\)
Fitting KNN
k_default <-
  odd_above_sqrt(nrow(train))

standardize <- function(d) {
  cbind(
    (d$balance -
       mean(train$balance)) /
      sd(train$balance),
    (d$income -
       mean(train$income)) /
      sd(train$income))
}

new_customers <- tibble(
  balance = c(1000, 2000, 2500),
  income = 40000)
knn_new <- class::knn(
  train = standardize(train),
  test = standardize(new_customers),
  cl = train$default,
  k = k_default, prob = TRUE)
knn_new
[1] No Yes Yes
attr(,"prob")
[1] 1.0000000 0.5352113 0.7183099
Levels: No YesKNN boundary
The boundary follows no formula: a jagged curve traced by the vote of the nearest training customers
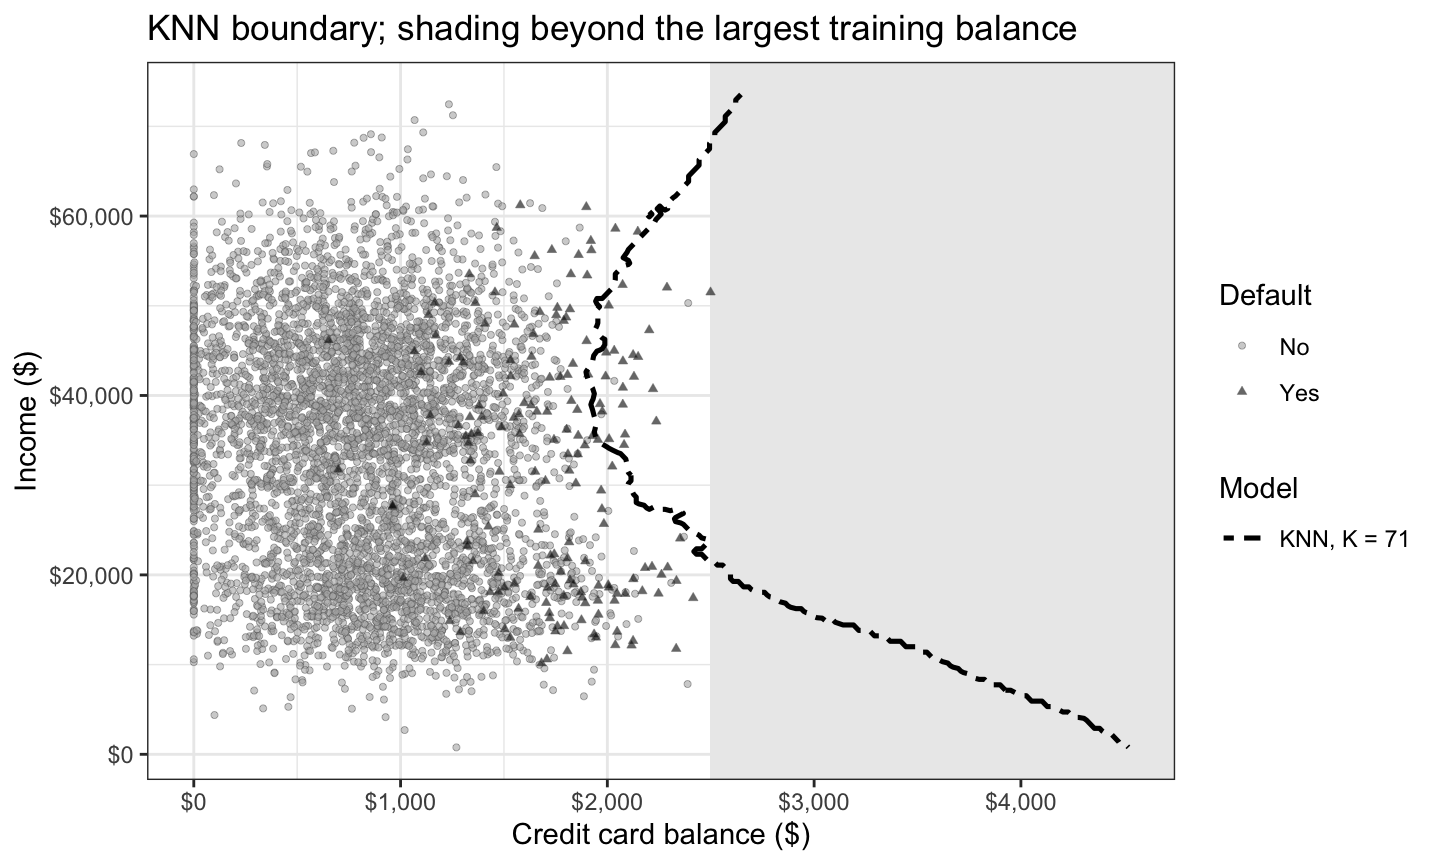
KNN boundary, K = 71, over the training customers; shading beyond the largest training balance
Comparing methods
Fitted boundaries
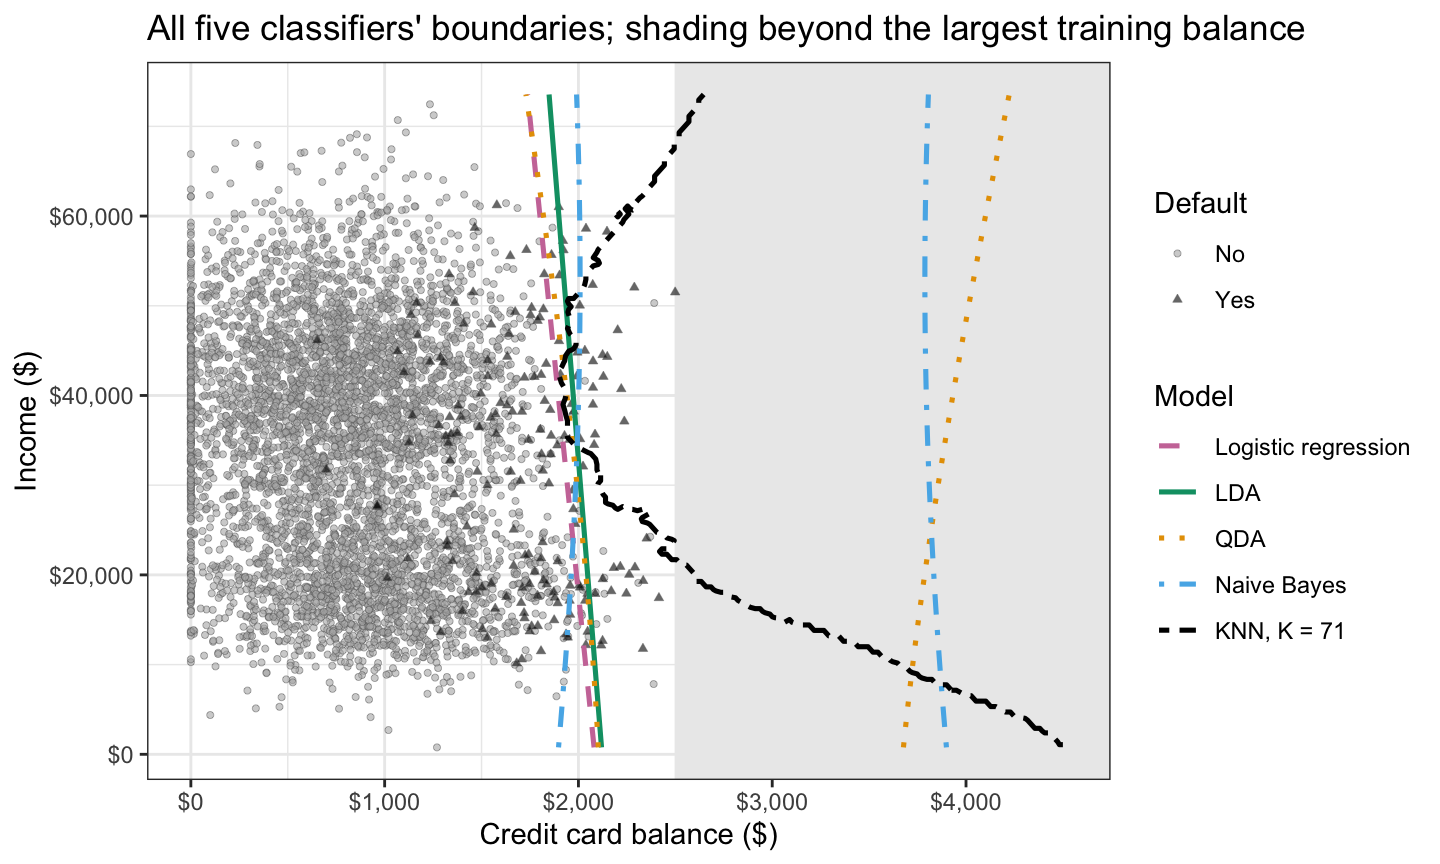
Logistic regression, LDA: lines · QDA, naive Bayes: curves · KNN, K = 71: jagged
Boundary shapes
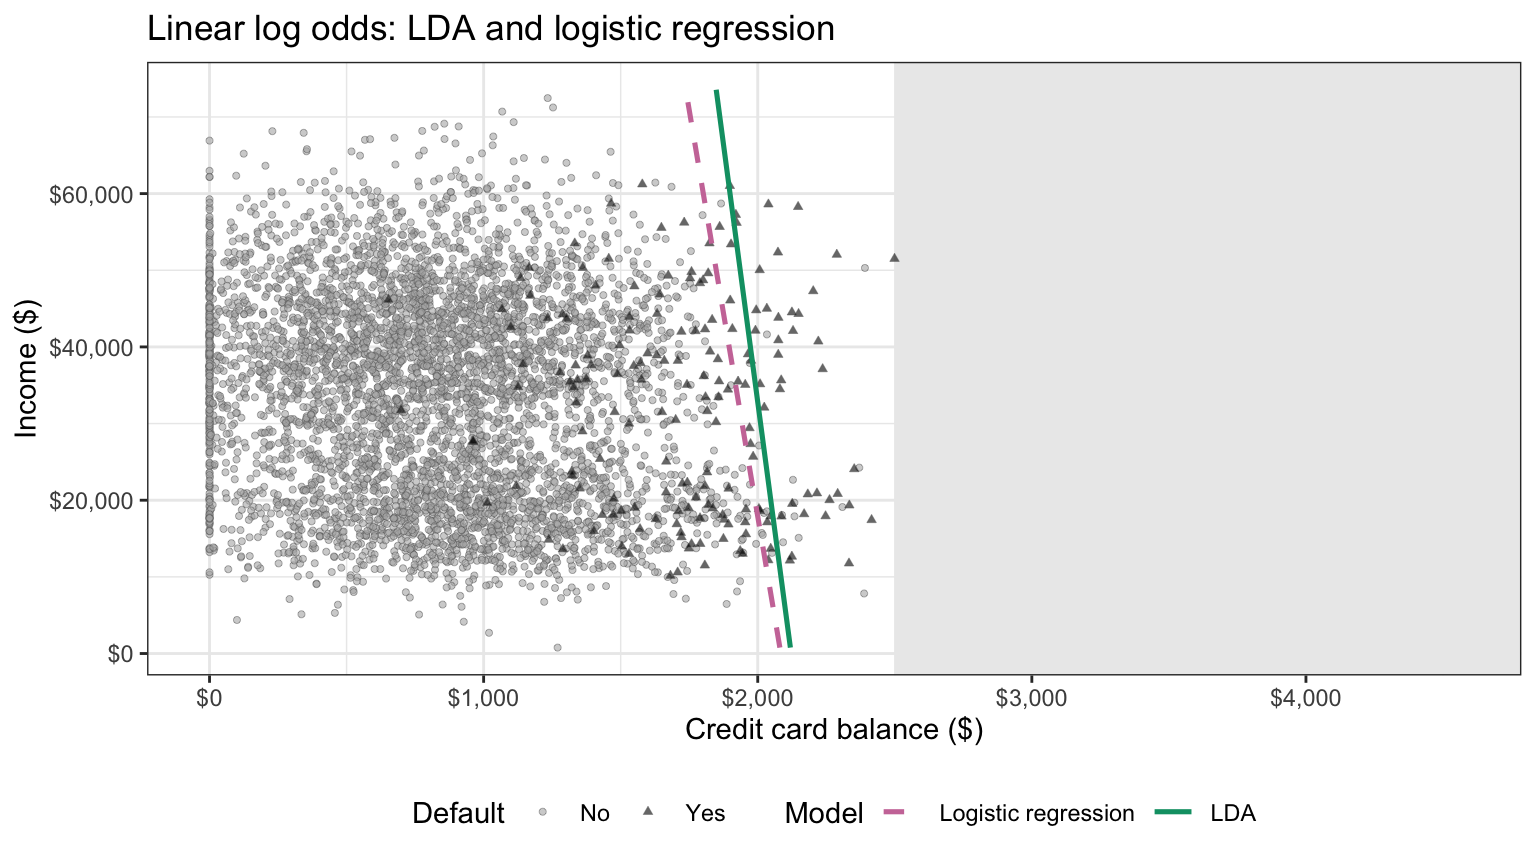
\[\begin{aligned} \text{LDA: } & \beta_0 + \sum_{j=1}^p \beta_j x_j, \\ \text{QDA: } & \beta_0 + \sum_{j=1}^p \beta_j x_j + \sum_{j \le l} \gamma_{jl} x_j x_l, \\ \text{Gaussian naive Bayes: } & \beta_0 + \sum_{j=1}^p \left(\beta_j x_j + \gamma_{jj} x_j^2\right) \end{aligned}\]
KNN: no formula, any shape
Boundary shapes: pairs
Logistic regression: linear in whatever features it is given
| Log-odds form | Generative classifier | Its parameters | Logistic regression features | Its coefficients |
|---|---|---|---|---|
| Linear | LDA | \(1 + 2p + p(p+1)/2\) (8) |
\(x_j\) | \(1 + p\) (3) |
| Additive, quadratic in each feature | Gaussian naive Bayes | \(1 + 4p\) (9) |
\(x_j\), \(x_j^2\) | \(1 + 2p\) (5) |
| Quadratic | QDA | \(1 + 2p + p(p+1)\) (11) |
\(x_j\), \(x_j^2\), \(x_j x_l\) | \(1 + p + p(p+1)/2\) (6) |
Parameter counts for two classes; below each formula, in parentheses, \(p = 2\)
Boundary shapes: fitted pairs
Each pair’s fitted \(0.5\) boundary; beyond the training balances the pairs part
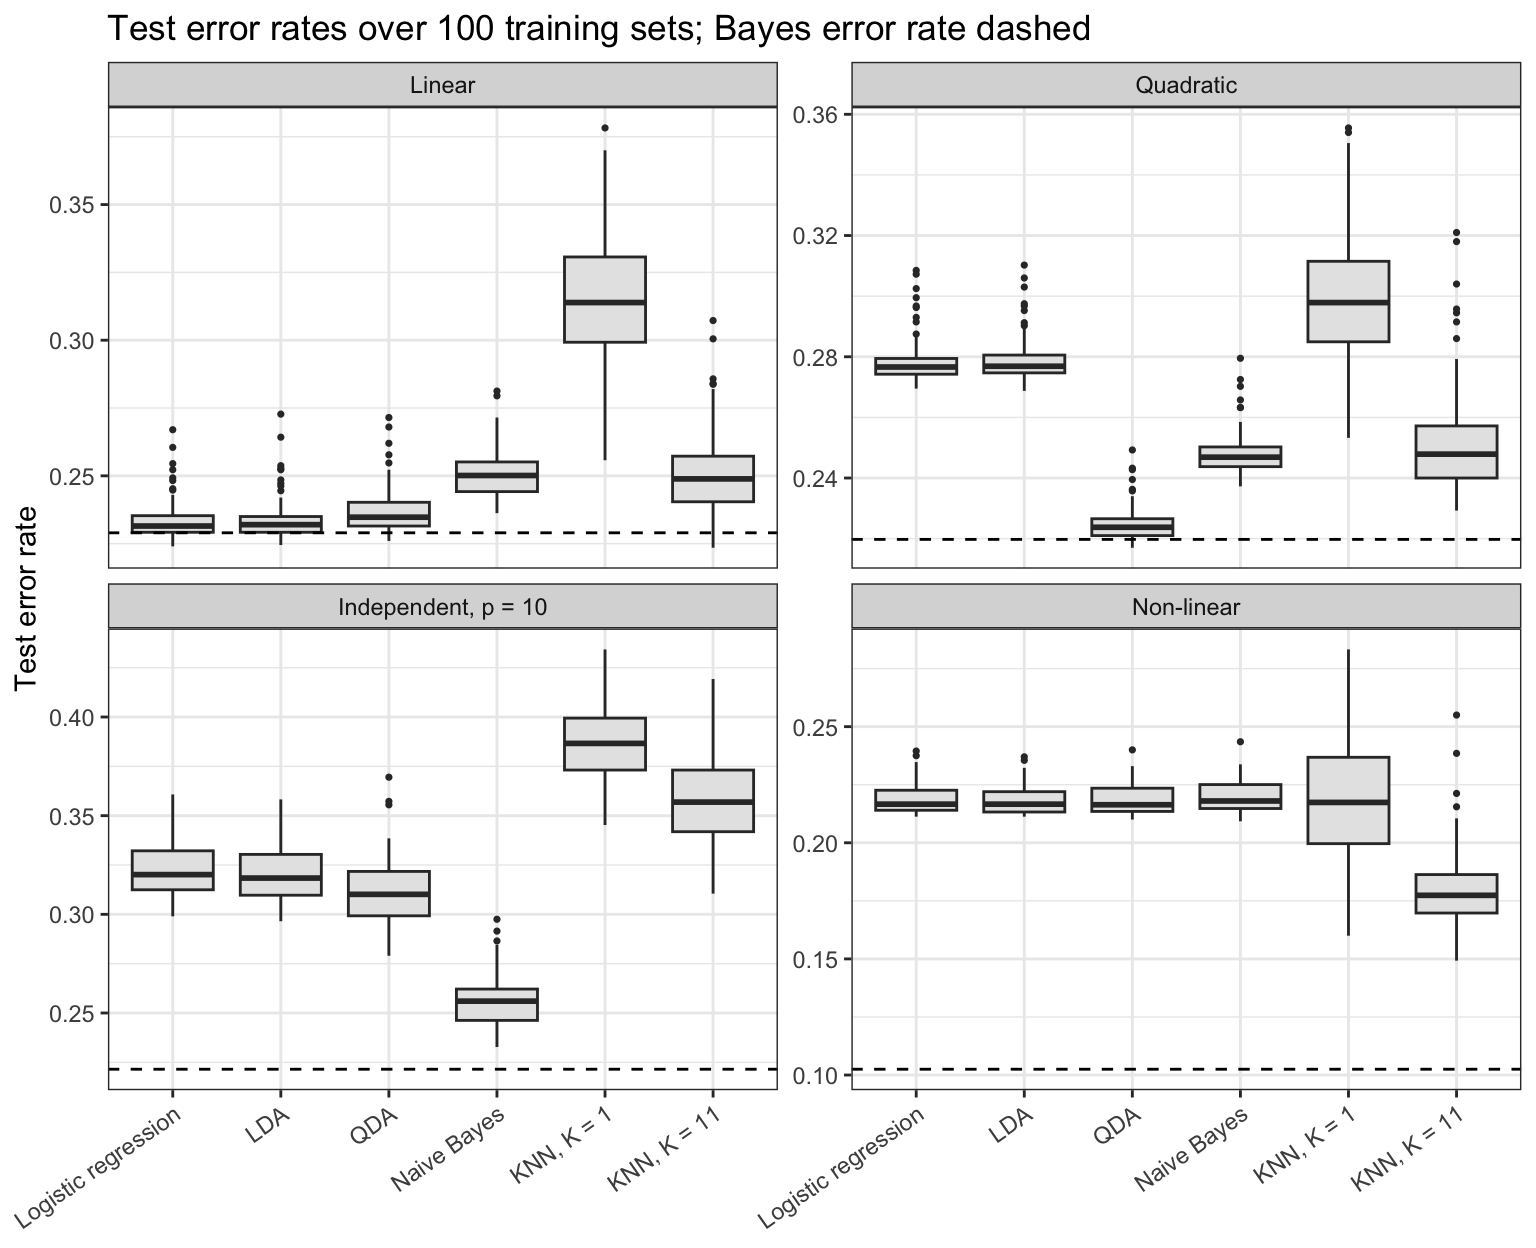
Simulated scenarios
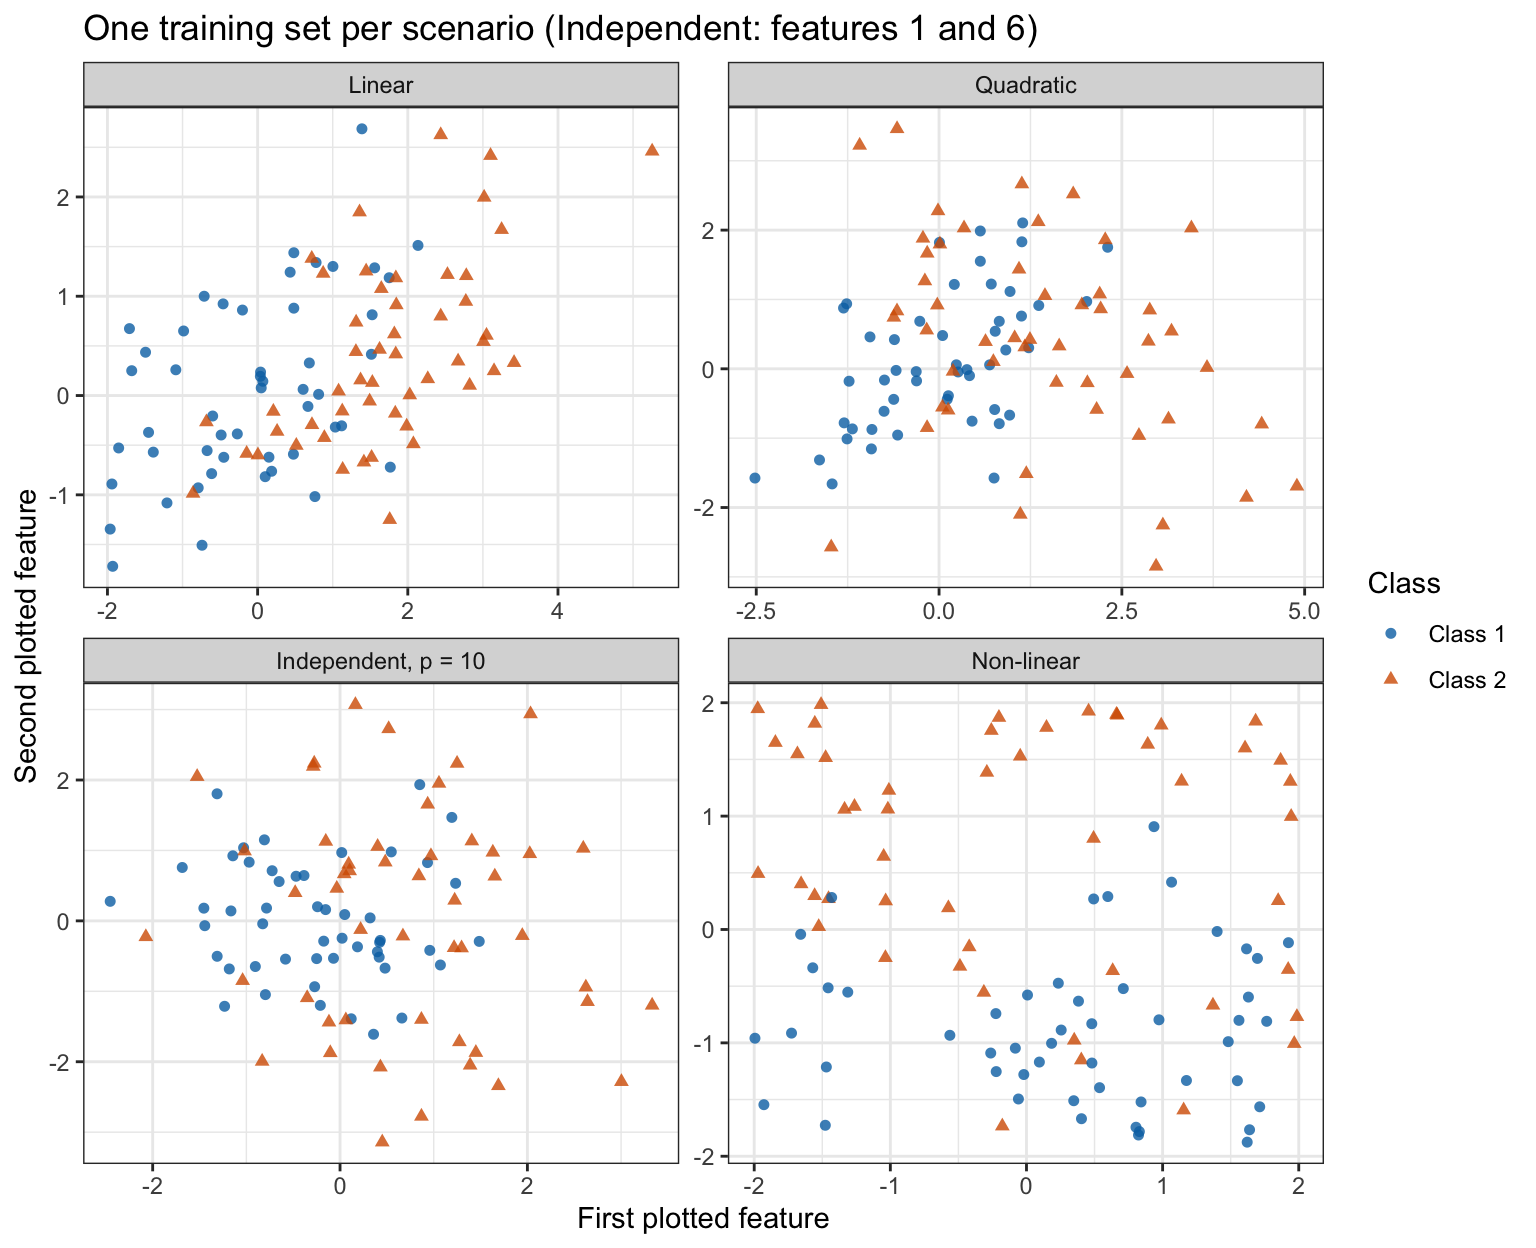
Each scenario makes a different method’s assumptions hold
Test performance
Fit on the training half; scored on the test half at threshold \(0.5\)
| Model | Training error | Test error | Test sensitivity | Test specificity | Test AUC |
|---|---|---|---|---|---|
| Logistic regression | 2.78% | 2.46% | 31.85% | 99.67% | 0.9551 |
| LDA | 2.96% | 2.54% | 24.84% | 99.81% | 0.9553 |
| QDA | 2.92% | 2.52% | 27.39% | 99.75% | 0.9550 |
| Naive Bayes | 3.12% | 2.46% | 28.03% | 99.79% | 0.9533 |
| KNN, K = 1 | 0.00% | 4.18% | 29.94% | 97.96% | 0.6395 |
| KNN, K = 71 | 3.12% | 2.88% | 10.83% | 99.92% | 0.9326 |
Student strata
Stratifying changes test error by at most 0.14 percentage points
Adding student to naive Bayes: test error rises 0.10 points, AUC falls 0.0022
| Model | Training error | Test error | Test sensitivity | Test AUC |
|---|---|---|---|---|
| QDA, single fit | 2.92% | 2.52% | 27.39% | 0.9550 |
| QDA, by student stratum | 2.78% | 2.66% | 24.84% | 0.9533 |
| Logistic regression, additive | 2.78% | 2.46% | 31.85% | 0.9551 |
| Logistic regression, interacted with student | 2.82% | 2.56% | 30.57% | 0.9547 |
| Naive Bayes, balance and income | 3.12% | 2.46% | 28.03% | 0.9533 |
| Naive Bayes, student as a feature | 3.28% | 2.56% | 28.66% | 0.9511 |
Conclusion
- QDA
- Quadratic boundary
- Naive Bayes
- Conditional independence
- Diagonal covariance
- K-nearest neighbors
- Comparing methods
DS 3030