Generalized Linear Models
Today
- Count response
- Poisson distribution
- Log-count regression
- Generalized linear models
- Poisson regression
- Maximum likelihood
- Rate ratios
- Inference
- Overdispersion
Count Response
Bike rentals
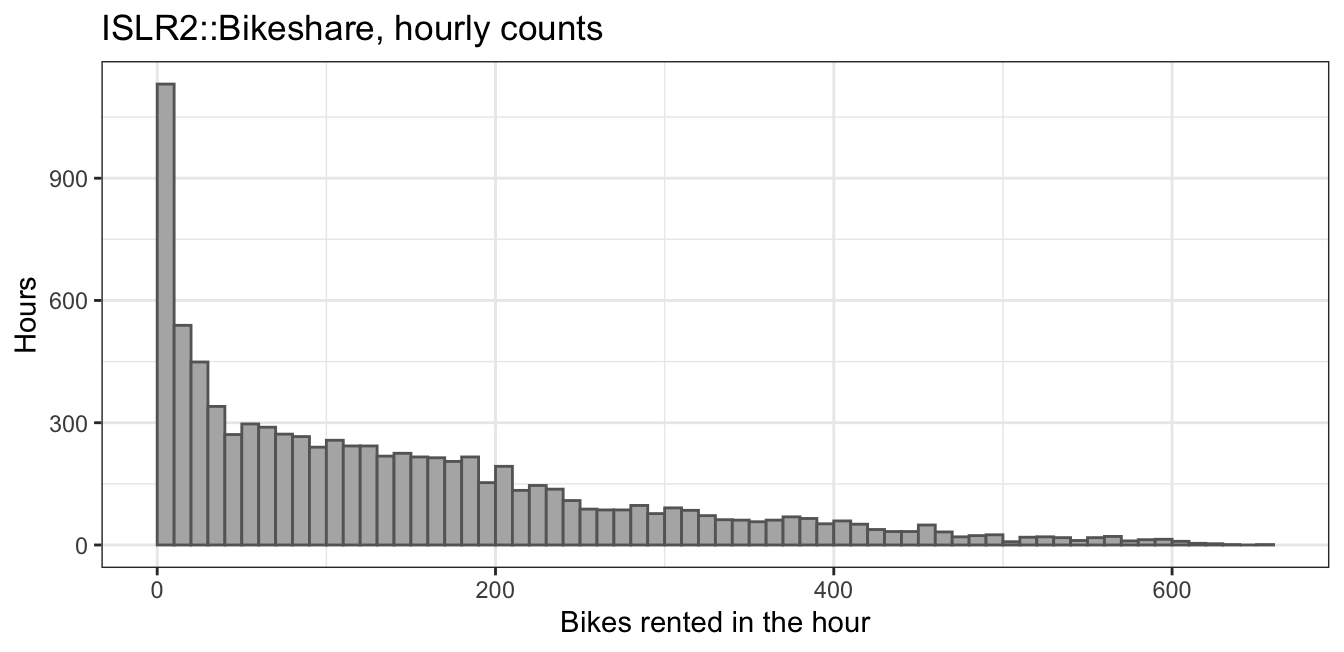
ISLR2::Bikeshare: 8,645 hours of one year in Washington, D.C.
- Response variable:
bikers, the number of bikes rented in the hour - Explanatory variables:
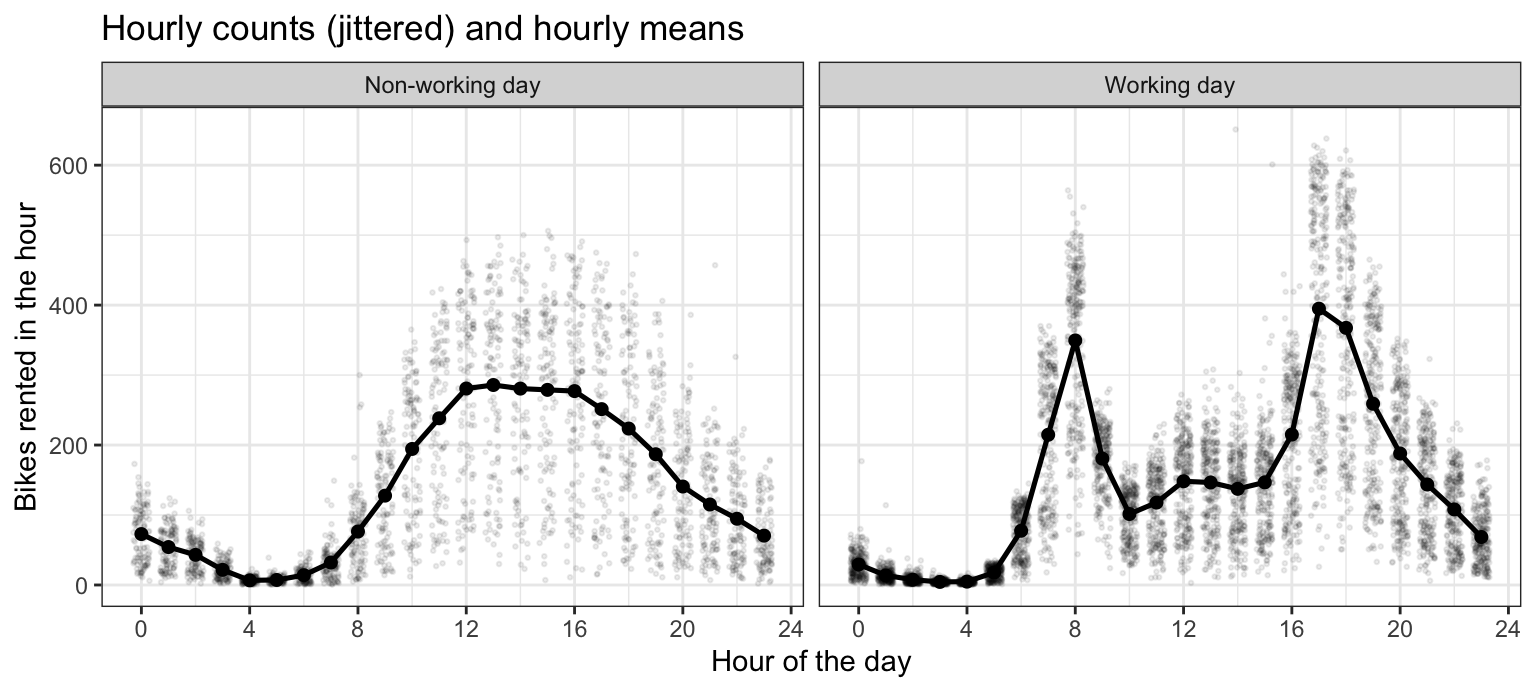
hr: hour of the day, 0 to 23workingday: working day or notmnth: monthtemp: temperature, rescaled to \([0, 1]\)weathersit: weather
Hourly counts
Poisson distribution
\[P(Y = y) = \frac{\mu^{y} e^{-\mu}}{y!}, \qquad y = 0, 1, 2, \ldots\]
\(\mu > 0\) — mean
\[E[Y] = Var[Y] = \mu\]
Poisson distribution, slider
{
  const pmf = transpose(poisson_pmf).filter(d => Math.abs(d.mu - mu) < 1e-9);
  const sd = Math.sqrt(mu);
  const xmax = Math.max(10, Math.ceil(mu + 4 * sd));
  const ymax = 1.15 * Math.max(...pmf.map(d => d.prob));
  const plot = Plot.plot({
    width: 900, height: 340, style: {fontSize: "16px"},
    x: {domain: [-0.5, xmax + 0.5], label: "Count y"},
    y: {domain: [0, ymax], label: "P(Y = y)"},
    marks: [
      Plot.rect([{x1: mu - sd, x2: mu + sd}],
                {x1: "x1", x2: "x2", y1: 0, y2: ymax,
                 fill: "#0072B2", fillOpacity: 0.12}),
      Plot.ruleX(pmf.filter(d => d.y <= xmax),
                 {x: "y", y1: 0, y2: "prob", strokeWidth: 2}),
      Plot.dot(pmf.filter(d => d.y <= xmax),
               {x: "y", y: "prob", r: 2.5, fill: "black"}),
      Plot.ruleX([mu], {stroke: "#0072B2", strokeDasharray: "6,4",
                        strokeWidth: 2})
    ]
  });
  return html`<p style="text-align: center"><b>mean = variance = ${mu.toFixed(1)}</b>,
    standard deviation = ${sd.toFixed(2)}, P(Y = 0) = ${Math.exp(-mu).toFixed(3)}</p>
    <div style="display: flex; justify-content: center">${plot}</div>`;
}- Mean \(\mu\) from 1 to 40
- Band: one standard deviation, \(\sqrt{\mu}\)
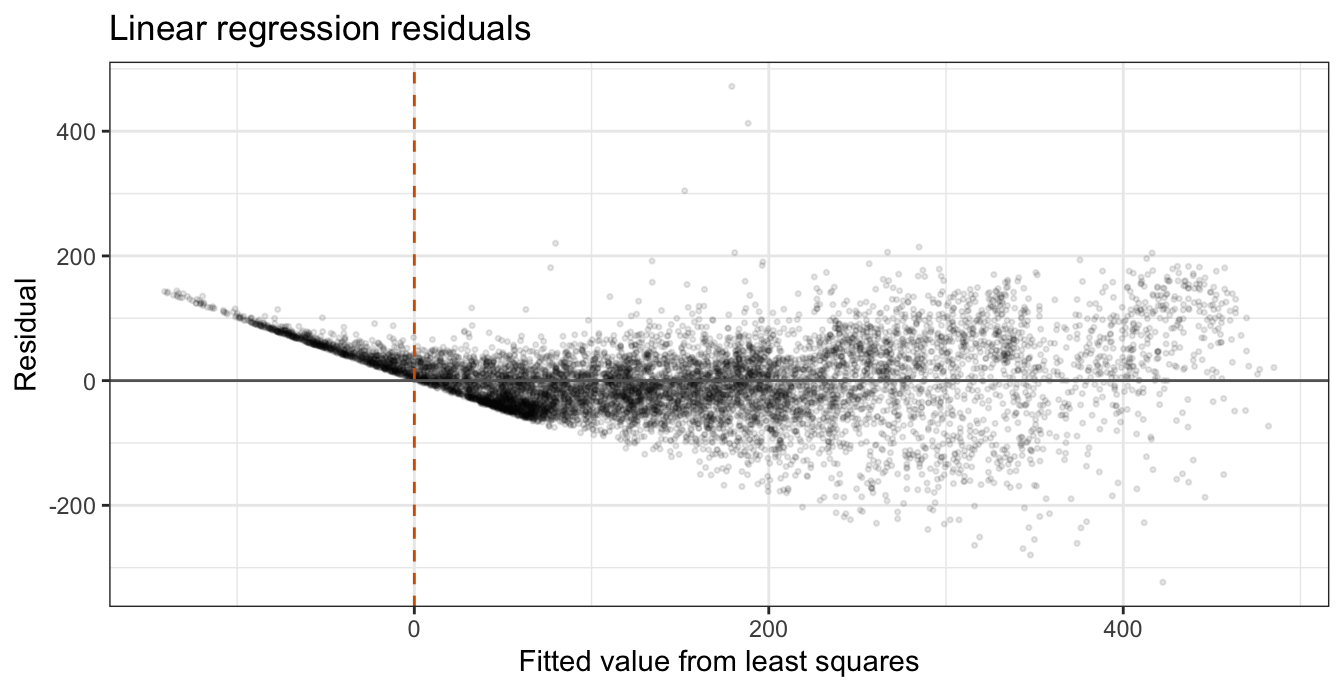
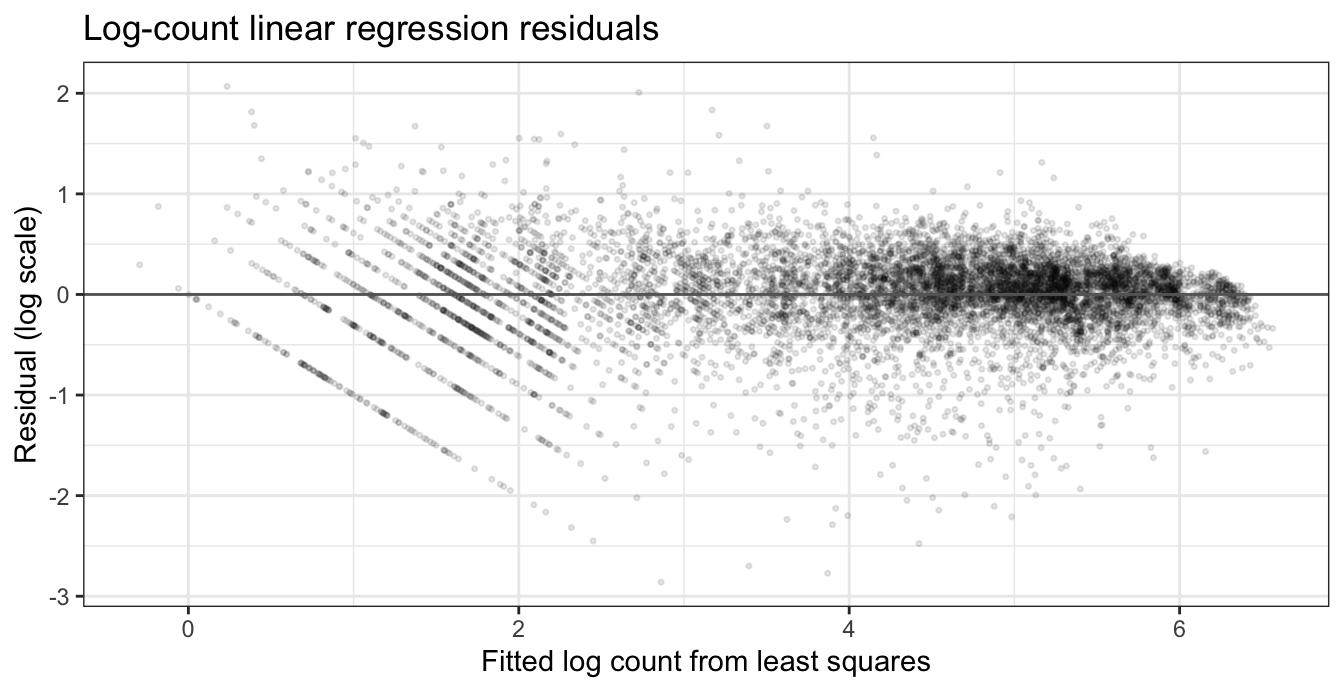
Linear regression fails
- 895 of 8,645 hours have a negative fitted mean
- Residuals fan out to the right
Log-count linear regression
\[\log Y_i \mid x_i \stackrel{ind}{\sim} N\left(x_i\gamma, \sigma^2\right)\]
Generalized Linear Models
Three components
\[Y_i \mid x_i \stackrel{ind}{\sim} \text{a distribution with mean } \mu_i, \qquad g(\mu_i) = \eta_i, \qquad \eta_i = x_i\beta\]
- \(\mu_i = E[Y_i \mid x_i]\) — mean of the response
- \(\eta_i\) — linear predictor
- \(g\) — link function, strictly monotone
Special cases
| Model | Response | Distribution of \(Y_i\) | Link \(g(\mu_i)\) | Mean \(\mu_i\) | Variance | glm() family |
|---|---|---|---|---|---|---|
| Linear regression | Quantitative | \(N(\mu_i, \sigma^2)\) | identity, \(\mu_i\) | \(\eta_i\) | \(\sigma^2\) | gaussian |
| Logistic regression | Binary (\(0/1\)) | \(\text{Bernoulli}(\mu_i)\) | logit, \(\log\left[\mu_i/(1 - \mu_i)\right]\) | \(e^{\eta_i}/\left(1 + e^{\eta_i}\right)\) | \(\mu_i(1 - \mu_i)\) | binomial |
| Poisson regression | Count | \(\text{Poisson}(\mu_i)\) | log, \(\log \mu_i\) | \(e^{\eta_i}\) | \(\mu_i\) | poisson |
Variance function
\[Var[Y_i \mid x_i] = \phi\, V(\mu_i)\]
- \(V\) — variance function
- \(\phi\) — dispersion parameter
| Distribution | \(V(\mu)\) | \(\phi\) |
|---|---|---|
| Normal | \(1\) | \(\sigma^2\) |
| Bernoulli | \(\mu(1 - \mu)\) | \(1\) |
| Poisson | \(\mu\) | \(1\) |
Transforming the mean
\[\text{log-count linear regression: } E[\log Y_i \mid x_i] = x_i\gamma, \qquad \text{Poisson regression: } \log E[Y_i \mid x_i] = x_i\beta\]
A GLM transforms the mean, not the response
A log link never takes \(\log y_i\): a count of 0 is fine
Poisson Regression
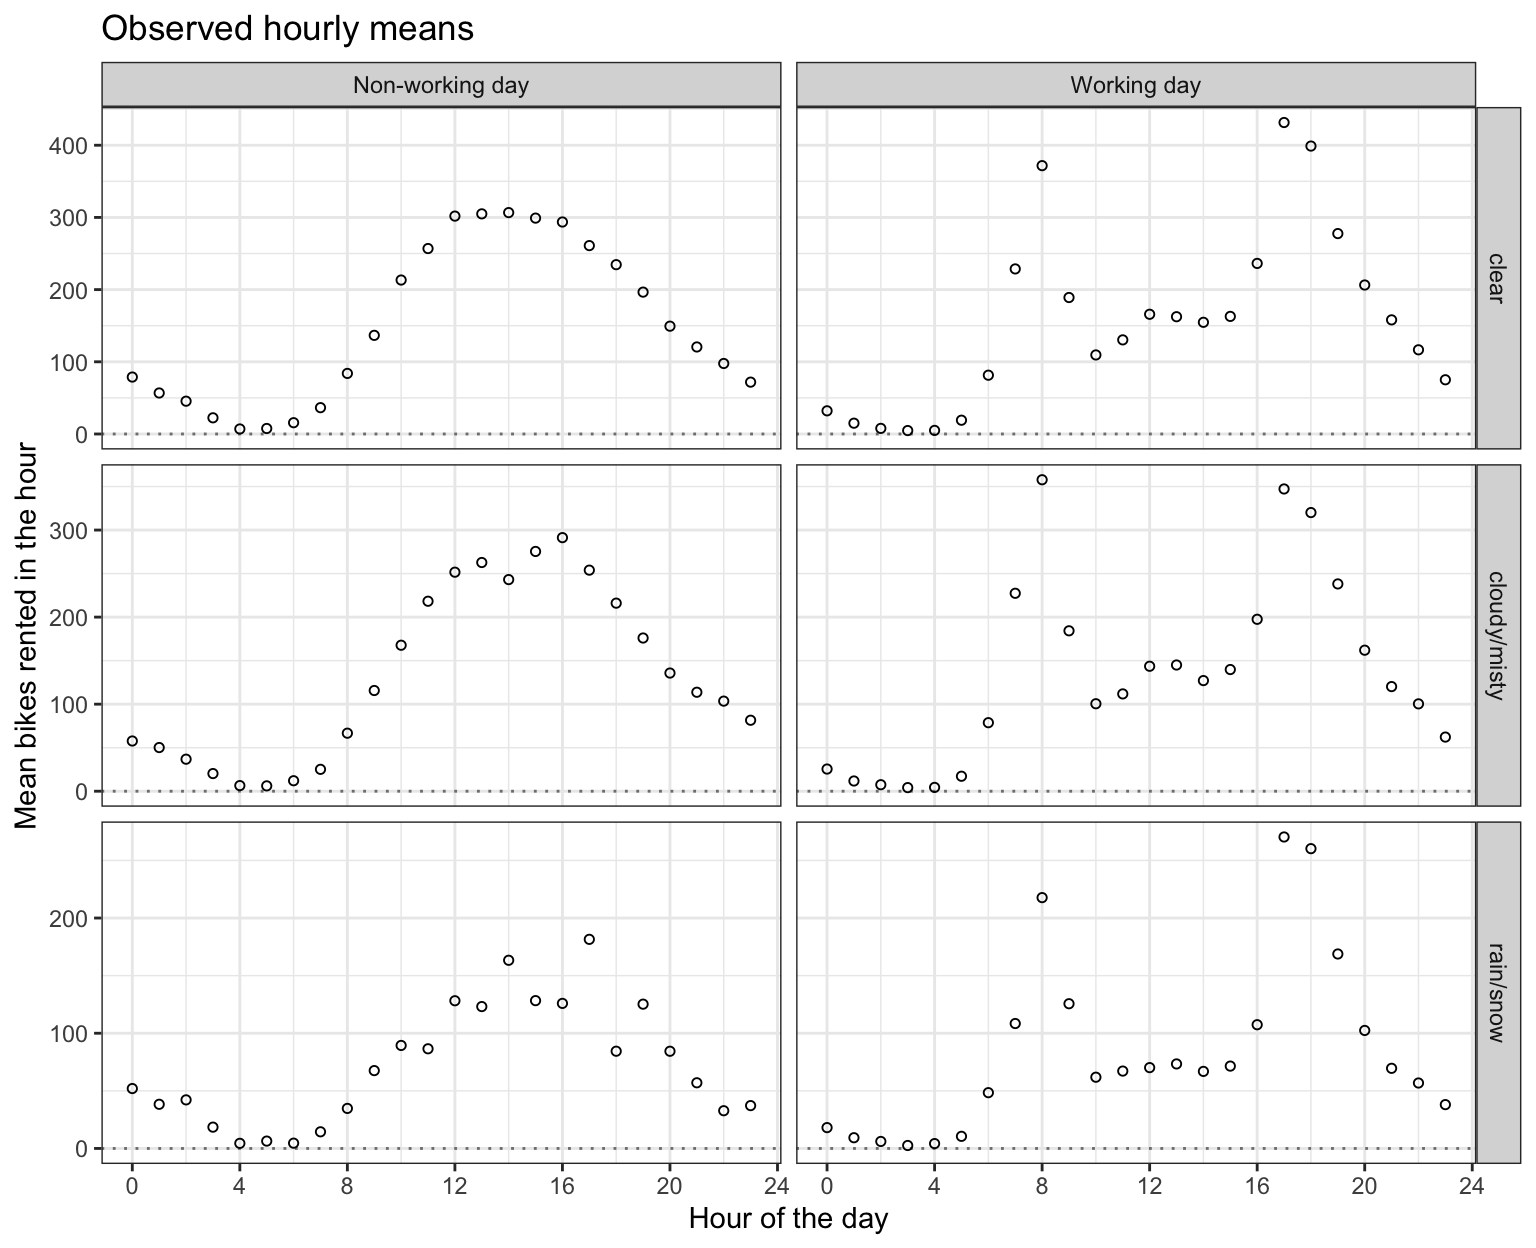
Observed hourly means
Rain scales the profile: 0.54 times clear at 3 a.m., 0.63 times at 5 p.m.
Log-linear model
\[Y_i \mid x_i \stackrel{ind}{\sim} \text{Poisson}(\mu_i), \qquad \log \mu_i = x_i\beta = \beta_0 + \beta_1 x_{i1} + \cdots + \beta_p x_{ip}\]
Poisson random component, log link
\[\mu_i = e^{x_i\beta} = e^{\beta_0} \times e^{\beta_1 x_{i1}} \times \cdots \times e^{\beta_p x_{ip}}\]
Features add on the log scale, multiply on the scale of the mean
Maximum likelihood estimation
\[\ell(\beta) = \sum_{i=1}^n \left[y_i \log \mu_i - \mu_i - \log(y_i!)\right] = \sum_{i=1}^n \left[y_i\, x_i\beta - e^{x_i\beta} - \log(y_i!)\right]\]
\[\sum_{i=1}^n x_{ij}\left(y_i - \mu_i\right) = 0, \qquad j = 0, 1, \ldots, p\]
- Same form as the logistic regression score equations
- No closed form: \(\mu_i = e^{x_i\beta}\) is nonlinear in \(\beta\)
Solved by iteratively reweighted least squares
Fitting
                       Estimate  Std. Error  z value  Pr(>|z|)
(Intercept)          3.36291632  0.01208439  278.286 < 2.2e-16 ***
workingYes          -0.91915334  0.01608340  -57.149 < 2.2e-16 ***
temp_c               0.01605829  0.00024332   65.998 < 2.2e-16 ***
weathercloudy/misty -0.06709450  0.00218683  -30.681 < 2.2e-16 ***
weatherrain/snow    -0.58063152  0.00406292 -142.910 < 2.2e-16 ***
---
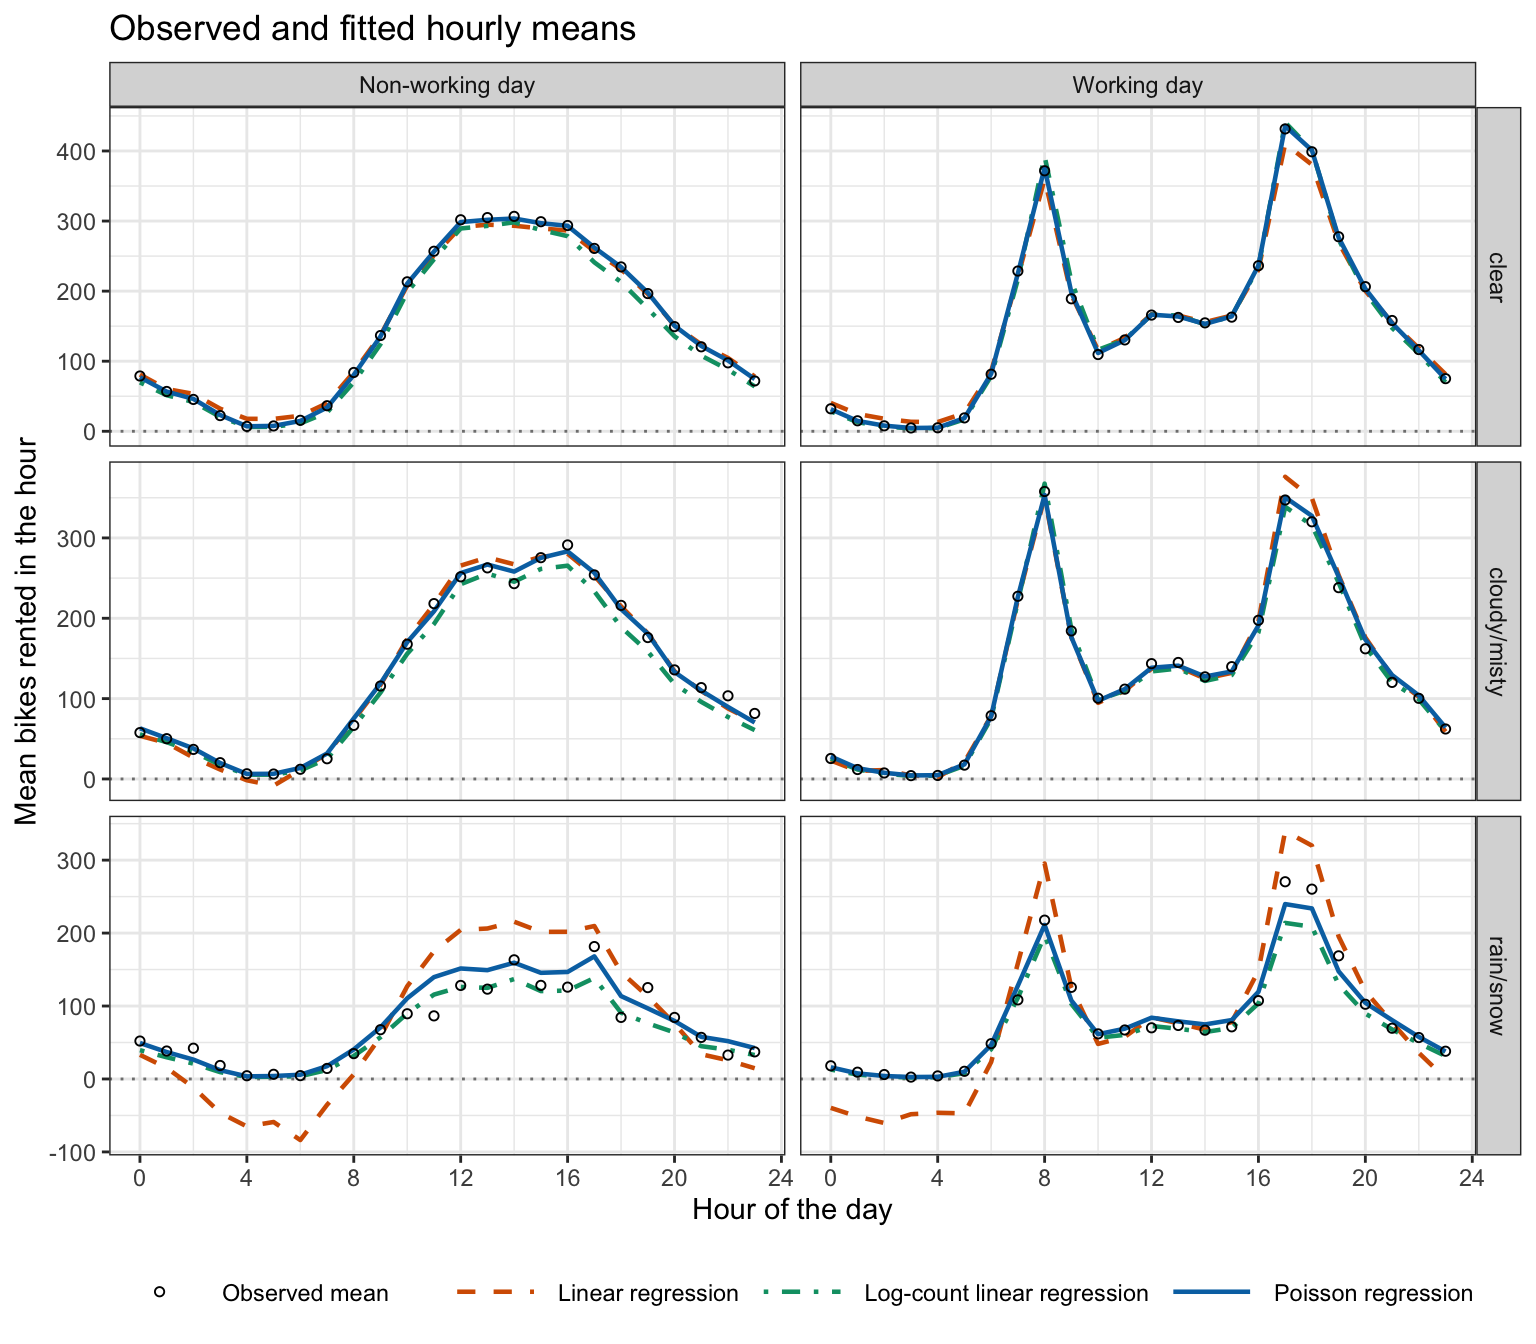
Signif. codes: 0 '***' 0.001 '**' 0.01 '*' 0.05 '.' 0.1 ' ' 1Fitted means
Coefficient interpretation
\(e^{\beta_0}\) — mean count when every feature is zero
\[\log \mu(x_j + 1) - \log \mu(x_j) = \beta_j, \qquad \frac{\mu(x_j + 1)}{\mu(x_j)} = e^{\beta_j}\]
\(e^{\beta_j}\) — rate ratio: factor multiplying the mean count per one-unit increase in feature \(j\), other features fixed
Rate ratios
| Coefficient | Estimate | \(e^{\widehat\beta_j}\) |
|---|---|---|
| Intercept | 3.3629 | 28.8733 |
| Working day (at hour 0) | -0.9192 | 0.3989 |
| Temperature (per degree C) | 0.0161 | 1.0162 |
| Cloudy/misty vs. clear | -0.0671 | 0.9351 |
| Rain/snow vs. clear | -0.5806 | 0.5595 |
Intercept: 28.9 bikers at hour 0, non-working day, January, clear, 0 °C (linear regression: −10.9)
Rain/snow: ×0.560, a 44% reduction at every hour
5 °C: ×1.084, an increase of 8.4%
Inference
\[z = \frac{\widehat\beta_j - \beta_j^0}{\text{SE}\left(\widehat\beta_j\right)}\]
\(\approx N(0, 1)\) under \(H_0: \beta_j = \beta_j^0\)
\[\widehat\beta_j \pm z_{1-\alpha/2}\,\text{SE}\left(\widehat\beta_j\right)\]
Exponentiate the endpoints: interval for the rate ratio \(e^{\beta_j}\)
- \(|z|\) from 30.7 to 142.9, so every 95% interval excludes 1
- Working day at hour 0: (0.386, 0.412)
- 5 °C: (1.081, 1.086)
- Cloudy/misty: (0.931, 0.939)
- Rain/snow: (0.555, 0.564)
Drop-in-deviance test
\[D = 2\left[\ell_{\text{sat}} - \ell\left(\widehat\beta\right)\right]\]
- \(D\) — deviance, not an indicator
- \(\ell_{\text{sat}}\) — saturated model, \(\mu_i = y_i\)
\[G^2 = D_r - D_f = -2\left[\ell\left(\widehat\beta_r\right) - \ell\left(\widehat\beta_f\right)\right]\]
Under \(H_0\): the \(k\) dropped coefficients are zero, \(G^2 \approx \chi^2_k\)
anova(reduced, full, test = "Chisq")
Interaction test
Analysis of Deviance Table

Model 1: bikers ~ hr + working + mnth + temp_c + weather
Model 2: bikers ~ hr * working + mnth + temp_c + weather
  Resid. Df Resid. Dev Df Deviance  Pr(>Chi)
1      8606     228046
2      8583      99377 23   128669 < 2.2e-16 ***
---
Signif. codes:  0 '***' 0.001 '**' 0.01 '*' 0.05 '.' 0.1 ' ' 1
\(G^2 = 128{,}669\) on \(k = 23\) degrees of freedom, against a \(\chi^2_{23}\) mean of 23
Overdispersion
Pearson residuals
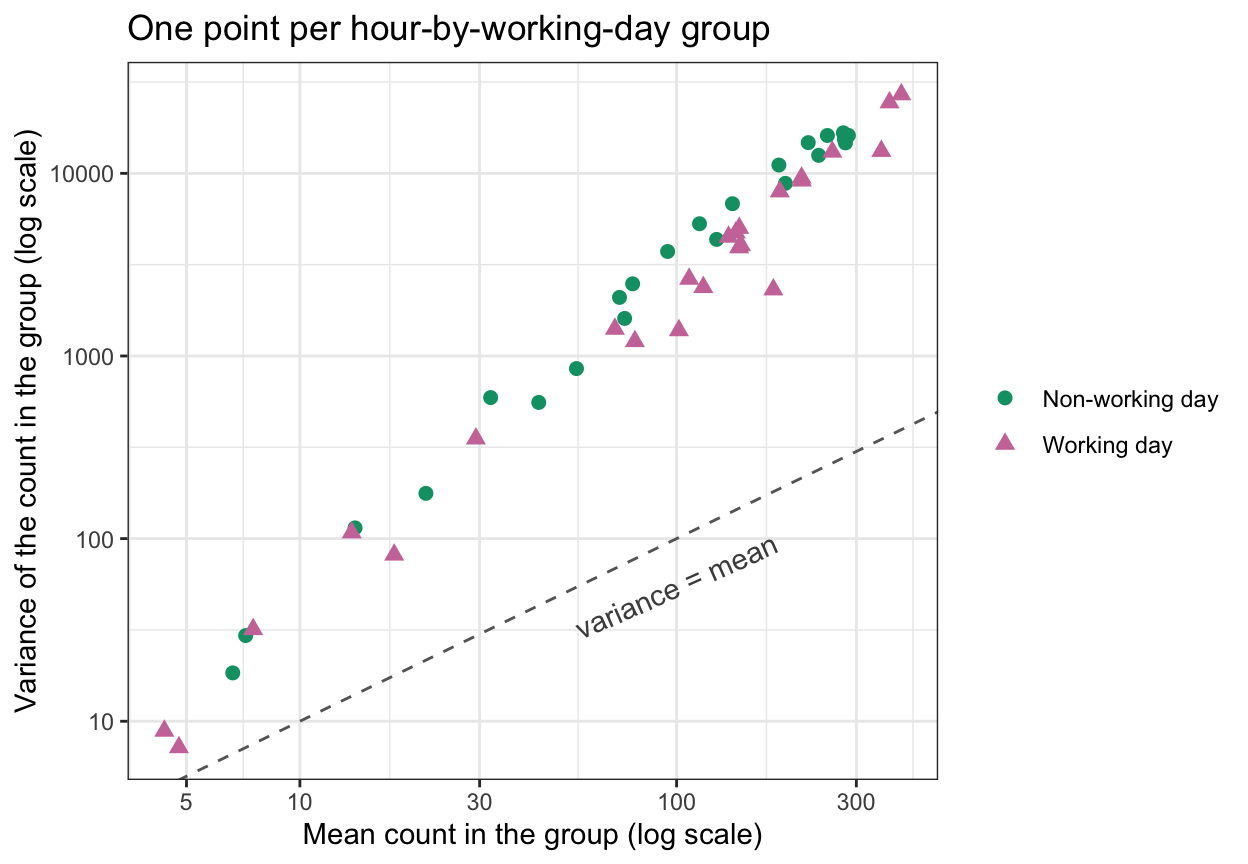
Overdispersion: \(Var[Y_i \mid x_i] > \mu_i\)
\[\frac{y_i - \widehat\mu_i}{\sqrt{\widehat\mu_i}}\]
Pearson residual: standardized by the Poisson standard deviation
\[\widehat\phi = \frac{1}{n - (p+1)}\sum_{i=1}^n \frac{\left(y_i - \widehat\mu_i\right)^2}{\widehat\mu_i}\]
- \(\widehat\phi\) — estimates the dispersion parameter, fixed at 1 by the Poisson model
- Well above 1: overdispersion
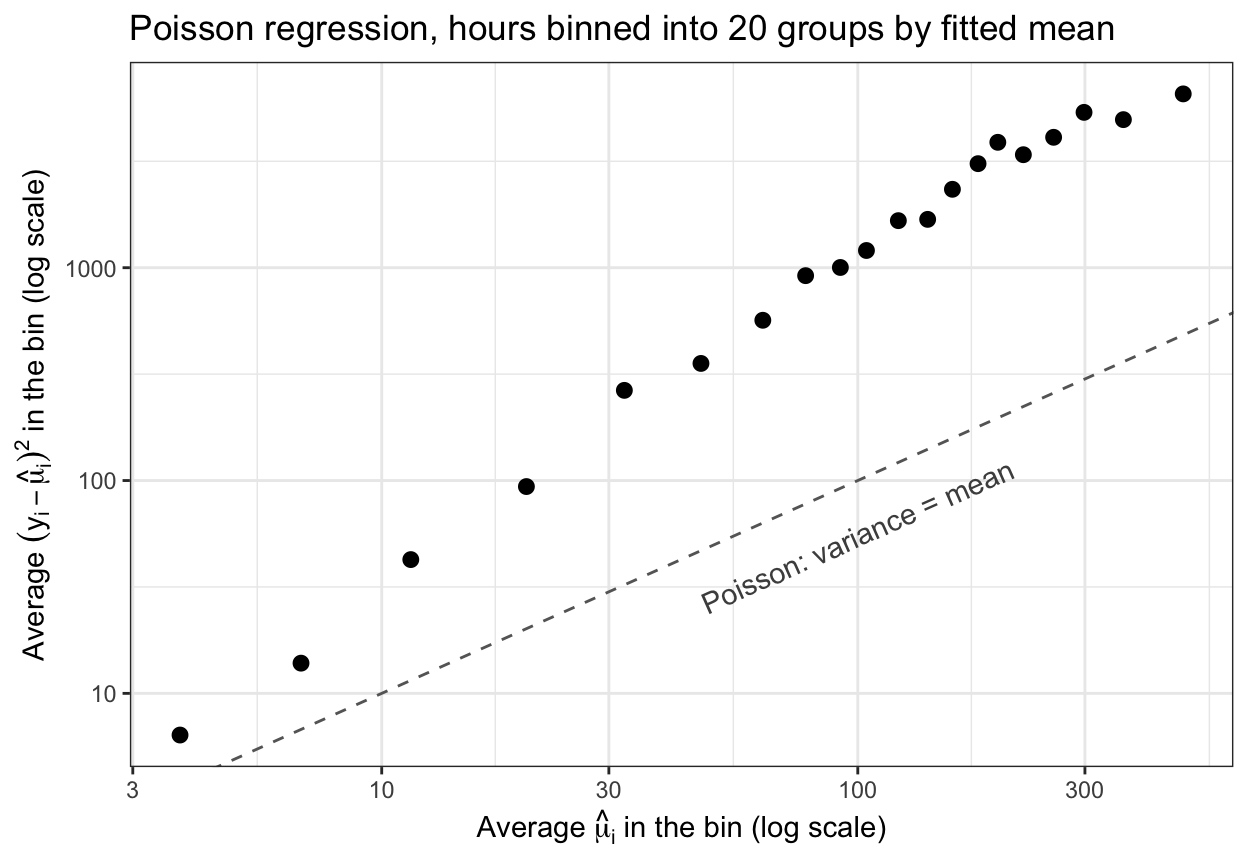
Variance check
- All 20 bins above the dashed line
- \(\widehat\phi = 11.3\) (additive model: 25.6)
Effects of overdispersion
- \(\widehat\beta\), fitted means, rate ratios: still sensible if the mean model is right
- Standard errors too small: \(z\) too large, intervals too narrow
- \(G^2\) too large against \(\chi^2_k\): \(G^2/\widehat\phi \approx \chi^2_k\)
\[G^2 / \widehat\phi = 11{,}380\]
495 times its 23 degrees of freedom: the interaction test’s conclusion survives
Conclusion
- Generalized linear model
- Poisson regression
- Rate ratio
- Log-count linear regression
- Score equations
- Wald tests
- Drop-in-deviance test
- Overdispersion
DS 3030