Principal Components Regression and Partial Least Squares
Today
- Diamond prices
- Data
- Least squares
- Principal components regression
- Model
- Estimate path
- Shrinkage factors
- Components kept
- Partial least squares
- First direction
- Later directions
- Directions compared
- Directions kept
- Comparison
Diamond prices
- Question: do a few linear combinations of the six measurements predict price better than all six?
- Response variable:
price, in US dollars - Explanatory variables:
carat,depth,table,x,y,z
- Training diamonds: 100
- Test diamonds: 53,817
Data
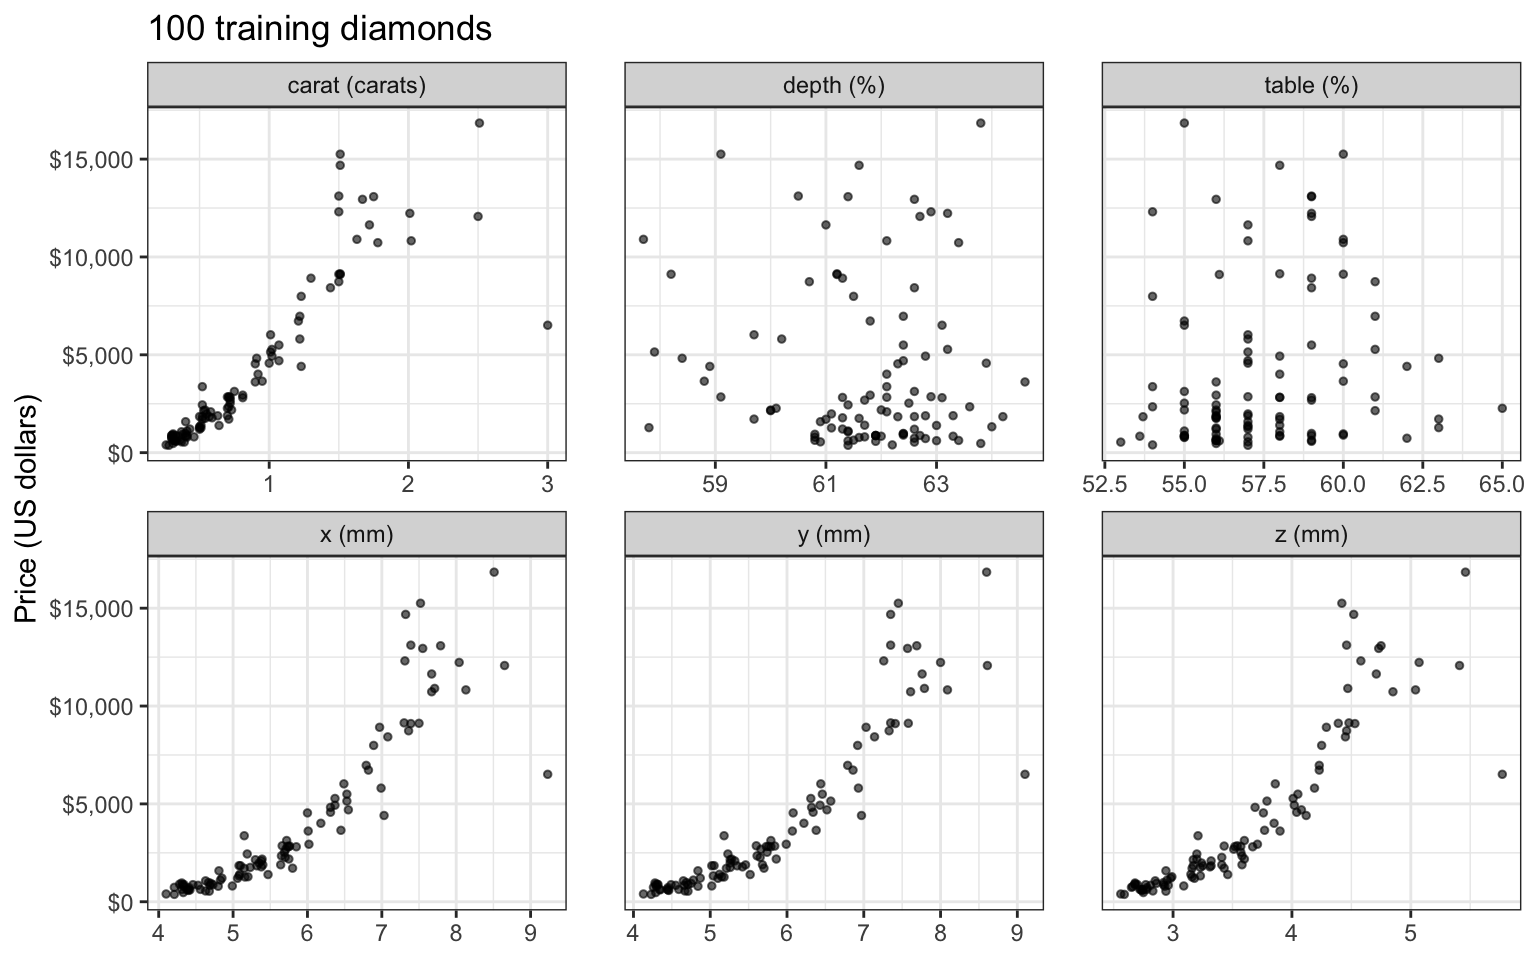
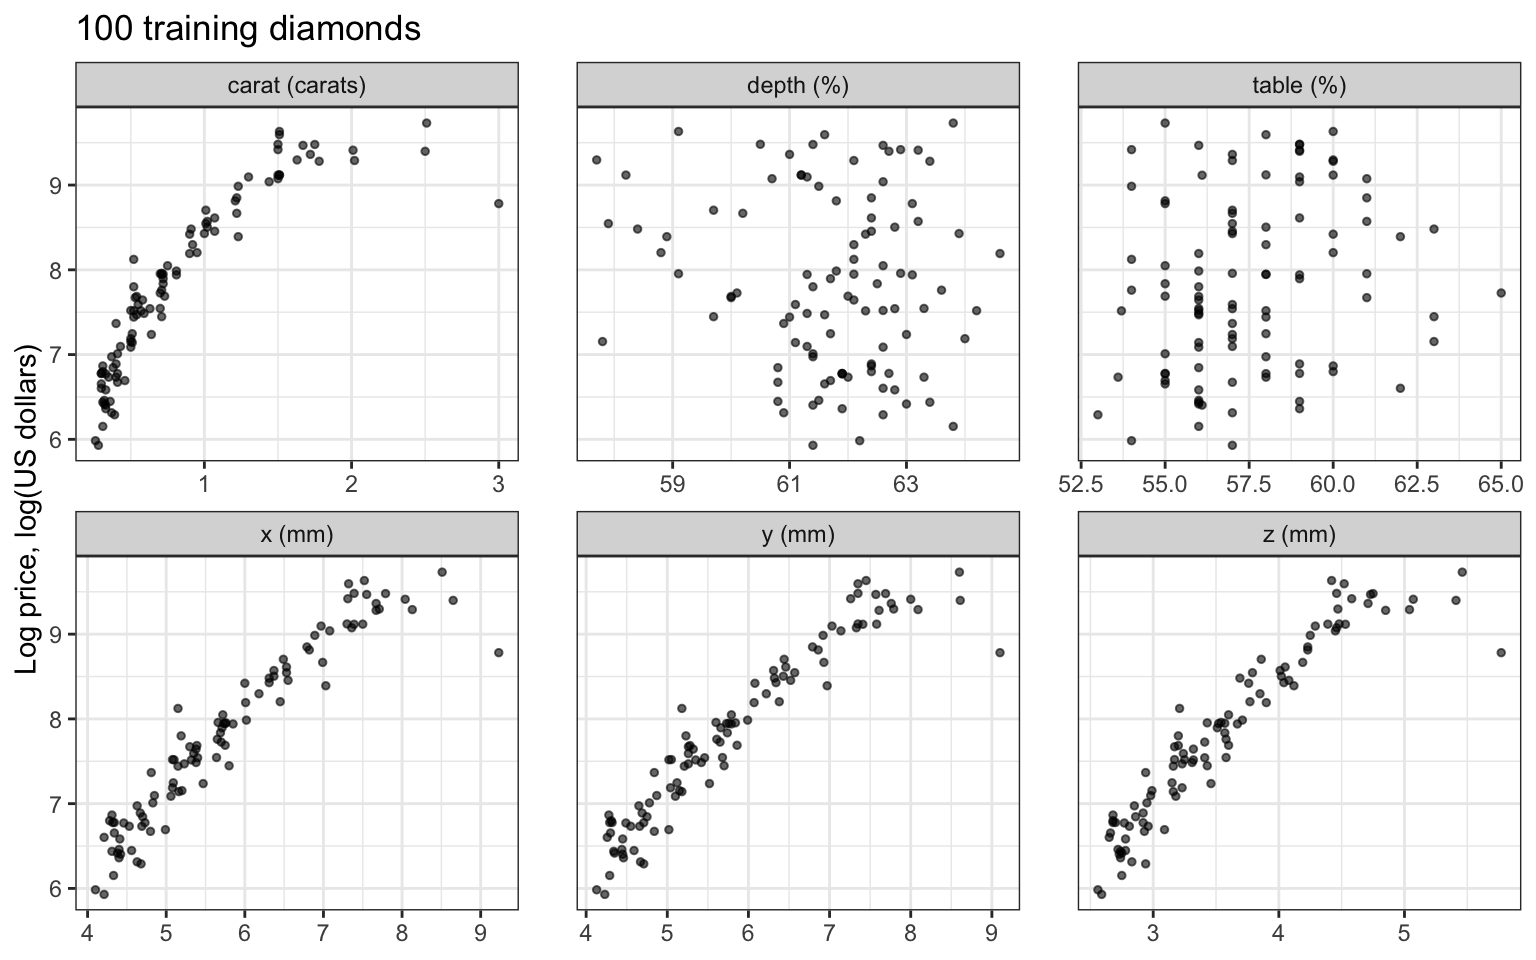
Least squares
- Response: \(y_i = \log\left(\texttt{price}_i\right)\)
- Training MSE 0.0618, test MSE 0.0726
- Carat estimate −1.86 (standard error 0.24), correlation of carat with log price 0.88
Principal components regression
Scores and price
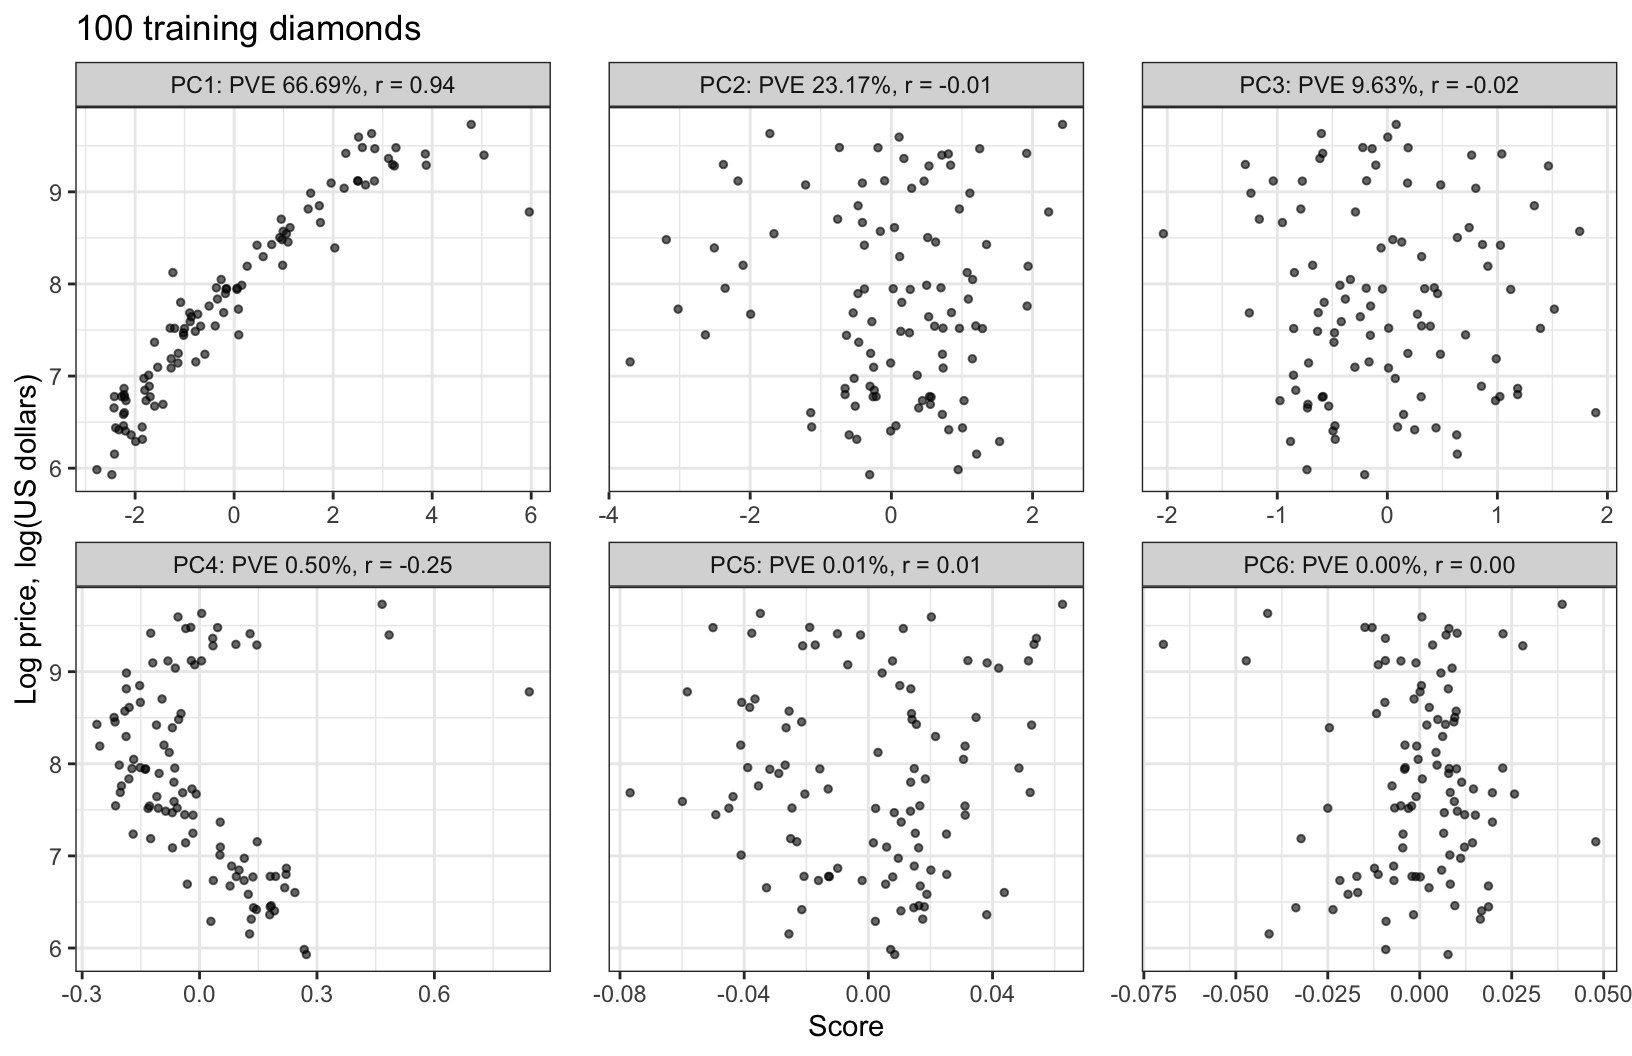
Model
\[y_i = \theta_0 + \sum_{m=1}^M\theta_m z_{im} + \epsilon_i, \qquad \epsilon_i \stackrel{ind}{\sim} N\left(0, \sigma^2\right)\]
- \(y_i\) — log price of training diamond \(i\)
- \(z_{im} = \tilde x_i\phi_m\) — score on the \(m\)th principal component
- \(M \in \{0, 1, \ldots, p\}\) — number of components kept
- \(\theta_0, \ldots, \theta_M\) — coefficients; \(\epsilon_i\) — error with variance \(\sigma^2\)
Component estimates
\[\widehat\theta_0 = \bar y, \qquad \widehat\theta_m = \frac{z_m^\top\left(y - \bar y\mathbf{1}\right)}{z_m^\top z_m} = \frac{z_m^\top\left(y - \bar y\mathbf{1}\right)}{nv_m}, \quad m = 1, \ldots, M\]
- \(\widehat\theta_m\) — simple regression estimate of \(y\) on \(z_m\)
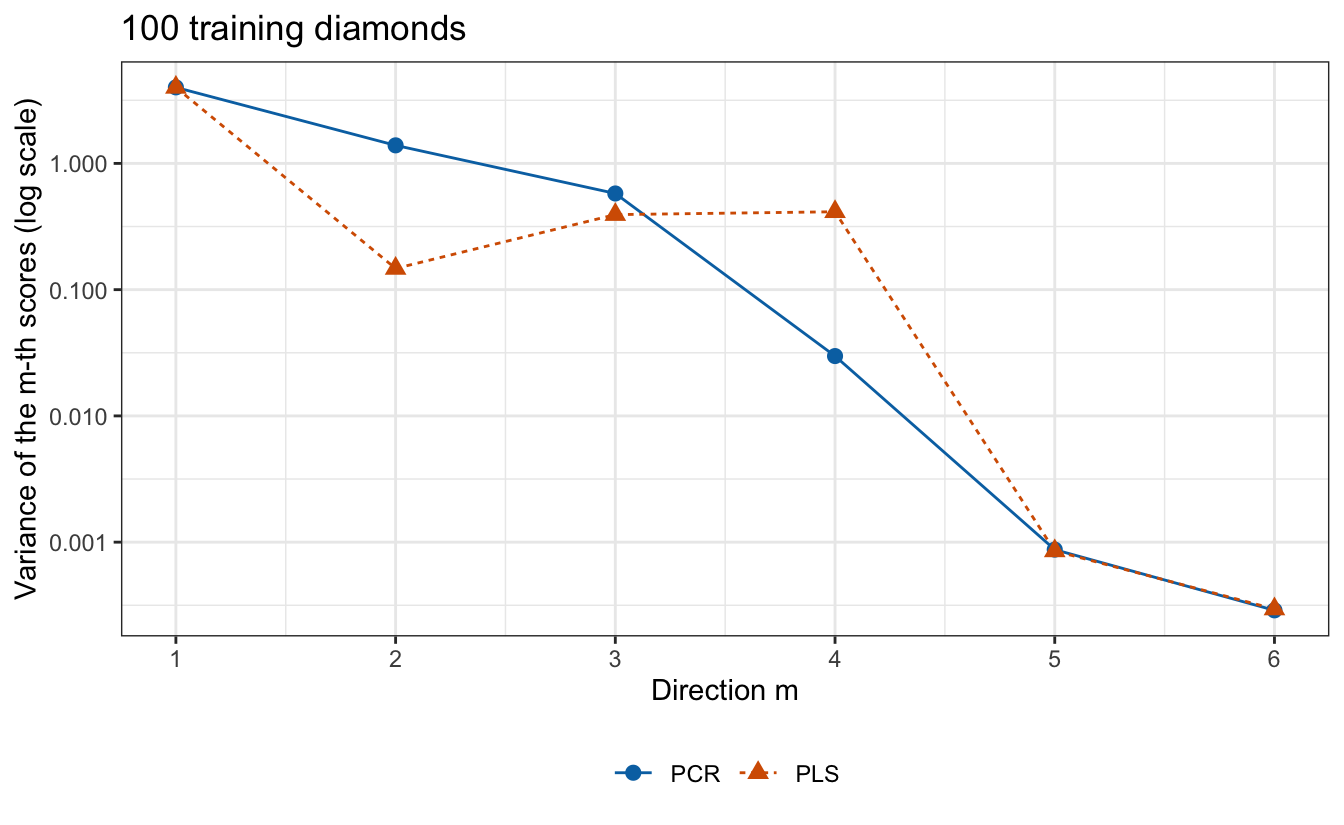
- \(v_m\) — variance of the \(m\)th scores
\[E\left[\widehat\theta_m\right] = \theta_m, \qquad Var\left[\widehat\theta_m\right] = \frac{z_m^\top z_m\,\sigma^2}{\left(nv_m\right)^2} = \frac{\sigma^2}{nv_m}\]
Estimates and standard errors
| Component | Variance \(v_m\) | Estimate \(\widehat\theta_m\) | Standard error | \(\lvert\widehat\theta_m\rvert\) / standard error |
|---|---|---|---|---|
| PC1 | 4.0012 | 0.479 | 0.013 | 37.1 |
| PC2 | 1.3899 | −0.011 | 0.022 | 0.5 |
| PC3 | 0.5779 | −0.029 | 0.034 | 0.9 |
| PC4 | 0.0298 | −1.474 | 0.149 | 9.9 |
| PC5 | 0.0009 | 0.235 | 0.873 | 0.3 |
| PC6 | 0.0003 | −0.133 | 1.518 | 0.1 |
Standardized-scale estimates
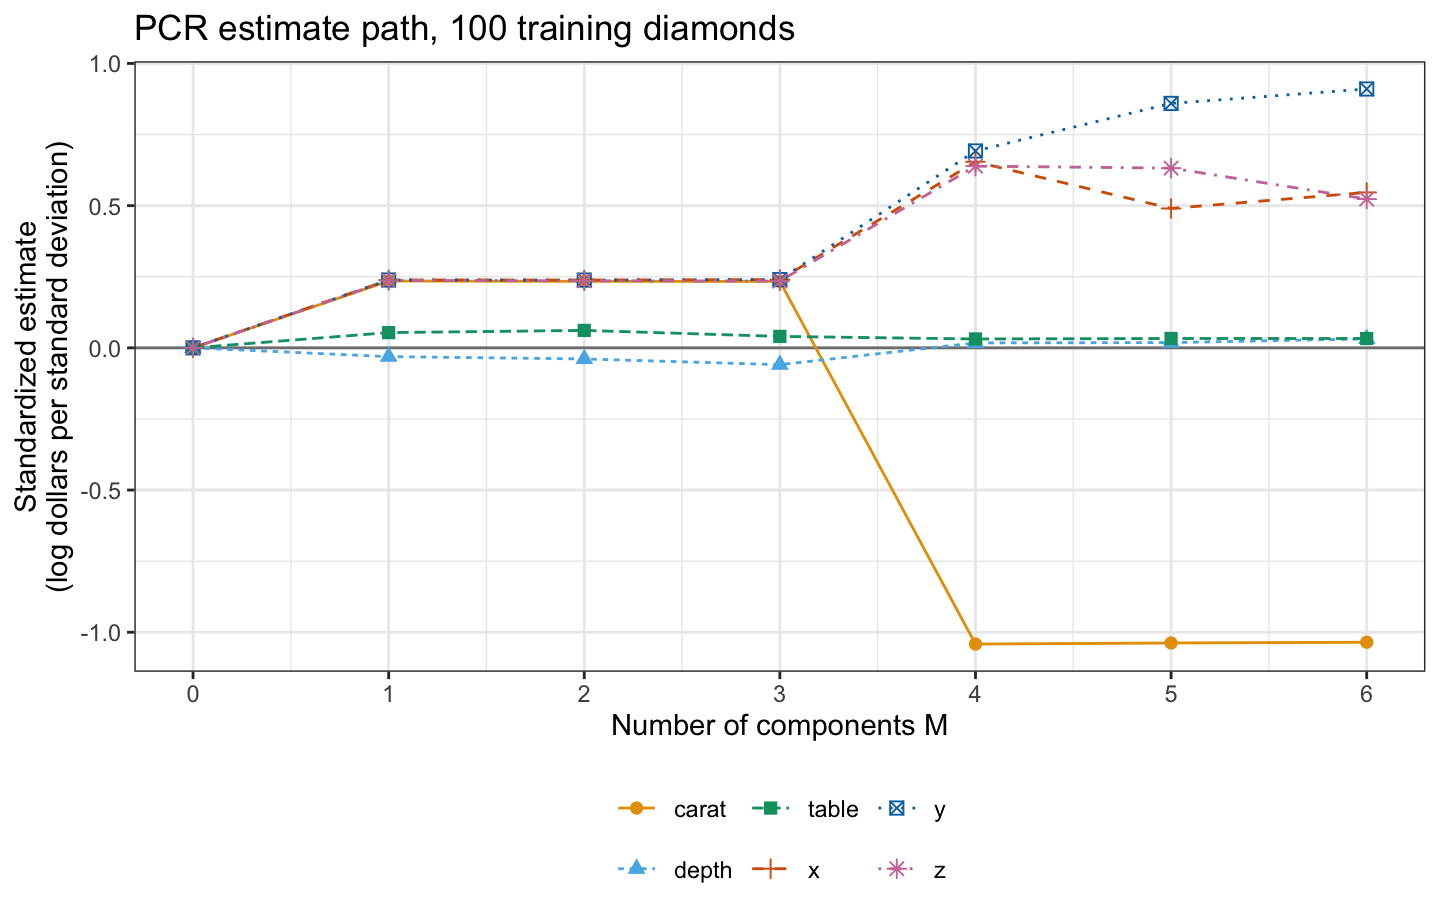
\[\widehat y_i = \bar y + \sum_{m=1}^M\widehat\theta_m\sum_{j=1}^p\phi_{jm}\tilde x_{ij} = \bar y + \sum_{j=1}^p\widehat\beta_j\tilde x_{ij}, \qquad \widehat\beta = \boldsymbol{\Phi}_M\widehat\theta\]
- \(\boldsymbol{\Phi}_M\) — \(p \times M\) matrix of the first \(M\) loading vectors
- \(\widehat\beta_j\) — PCR estimate on the standardized scale
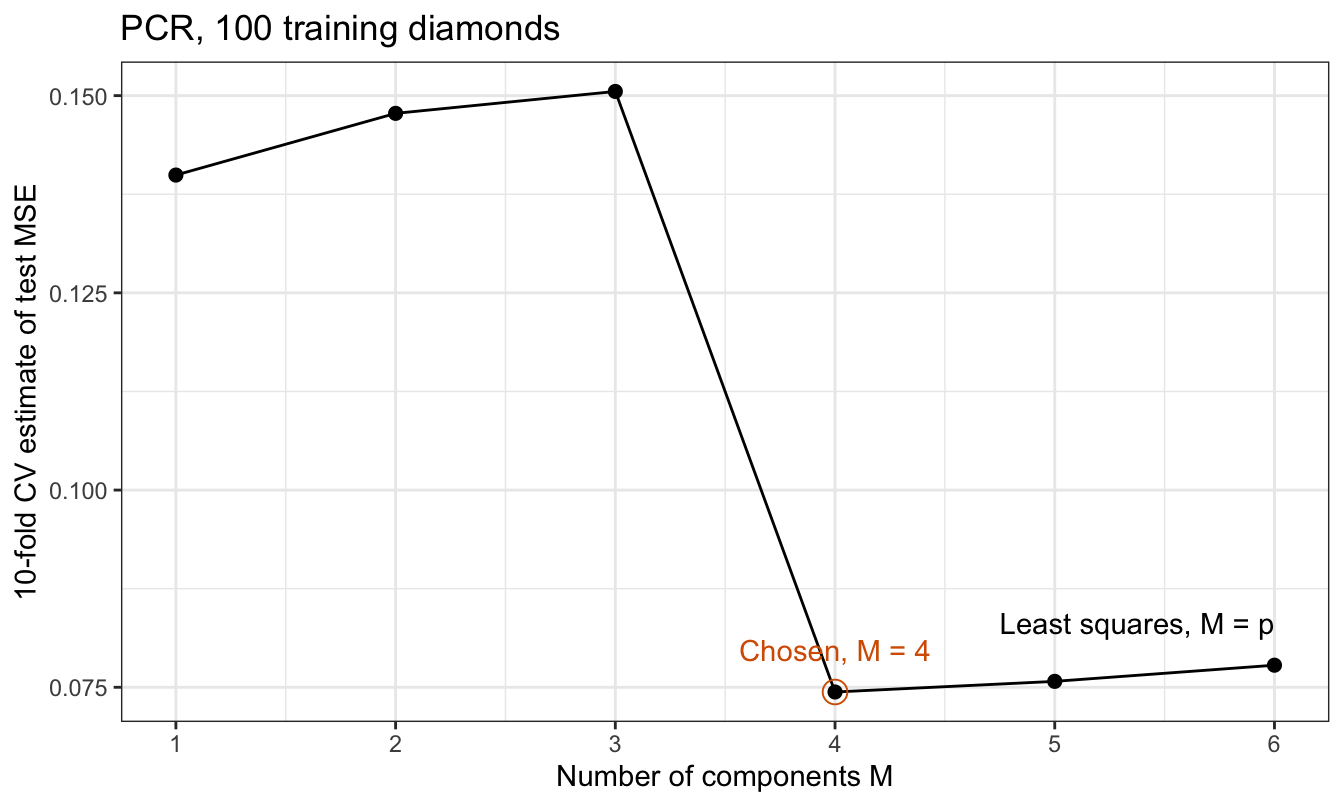
- \(M = p\) is least squares
- \(M = 0\) is the null model: \(M\) is the tuning parameter
- Not variable selection: every \(\widehat\beta_j\) is in general nonzero
Estimate path
Shrinkage factors
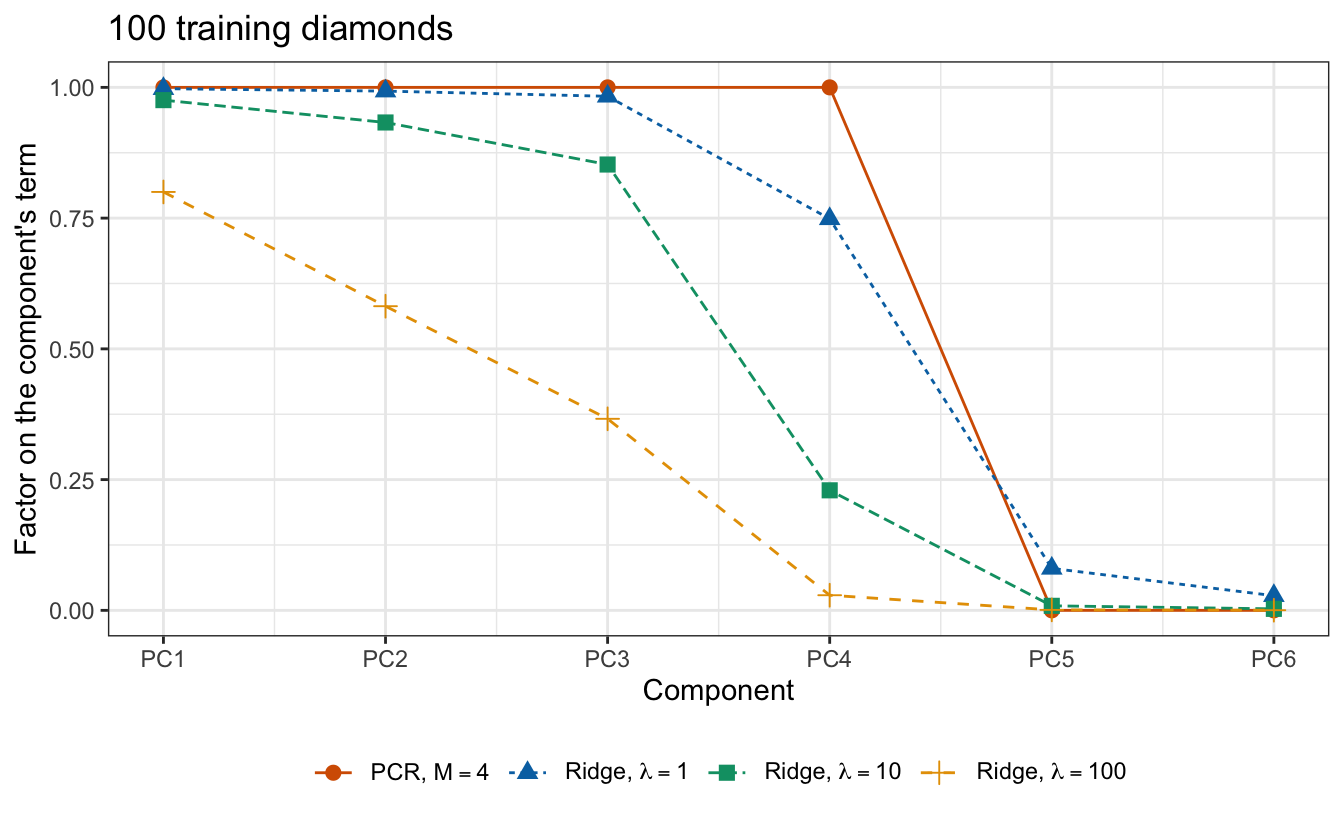
\[\widehat y^R_\lambda = \bar y\mathbf{1} + \sum_{m=1}^p\frac{v_m}{v_m + \lambda/n}\,\widehat\theta_mz_m\]
- Ridge regression: every term times \(v_m/\left(v_m + \lambda/n\right)\), between 0 and 1
- PCR: the first \(M\) terms times 1, the rest times 0
Factors by component
Components kept
Partial least squares
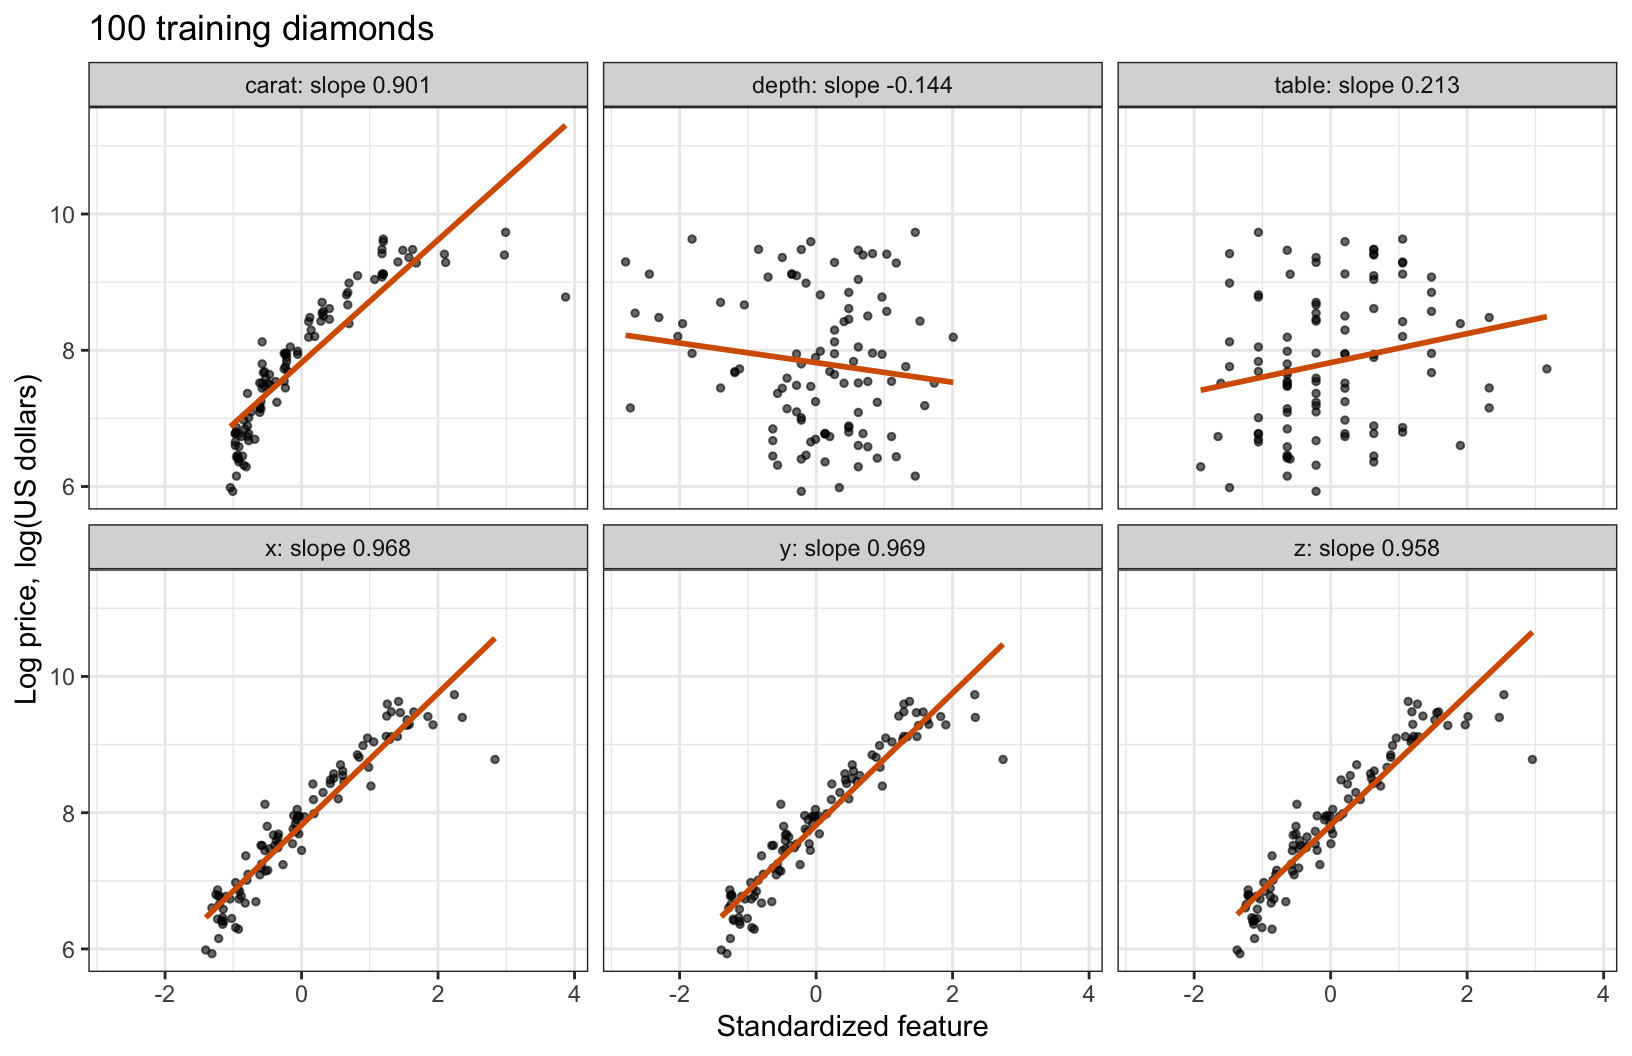
Features and price
First direction
\[\phi^{\text{PLS}}_{j1} = \frac{g_j}{\sqrt{\sum_{l=1}^p g_l^2}}, \qquad g_j = \frac{1}{n}\sum_{i=1}^n\tilde x_{ij}\left(y_i - \bar y\right)\]
- \(g_j\) — simple regression estimate of \(y\) on feature \(j\)
- \(\phi^{\text{PLS}}_1 = g/\left\|g\right\|\) — first PLS direction
- The first PLS direction is the unit vector whose scores have the largest squared covariance with the response
Loadings of three directions
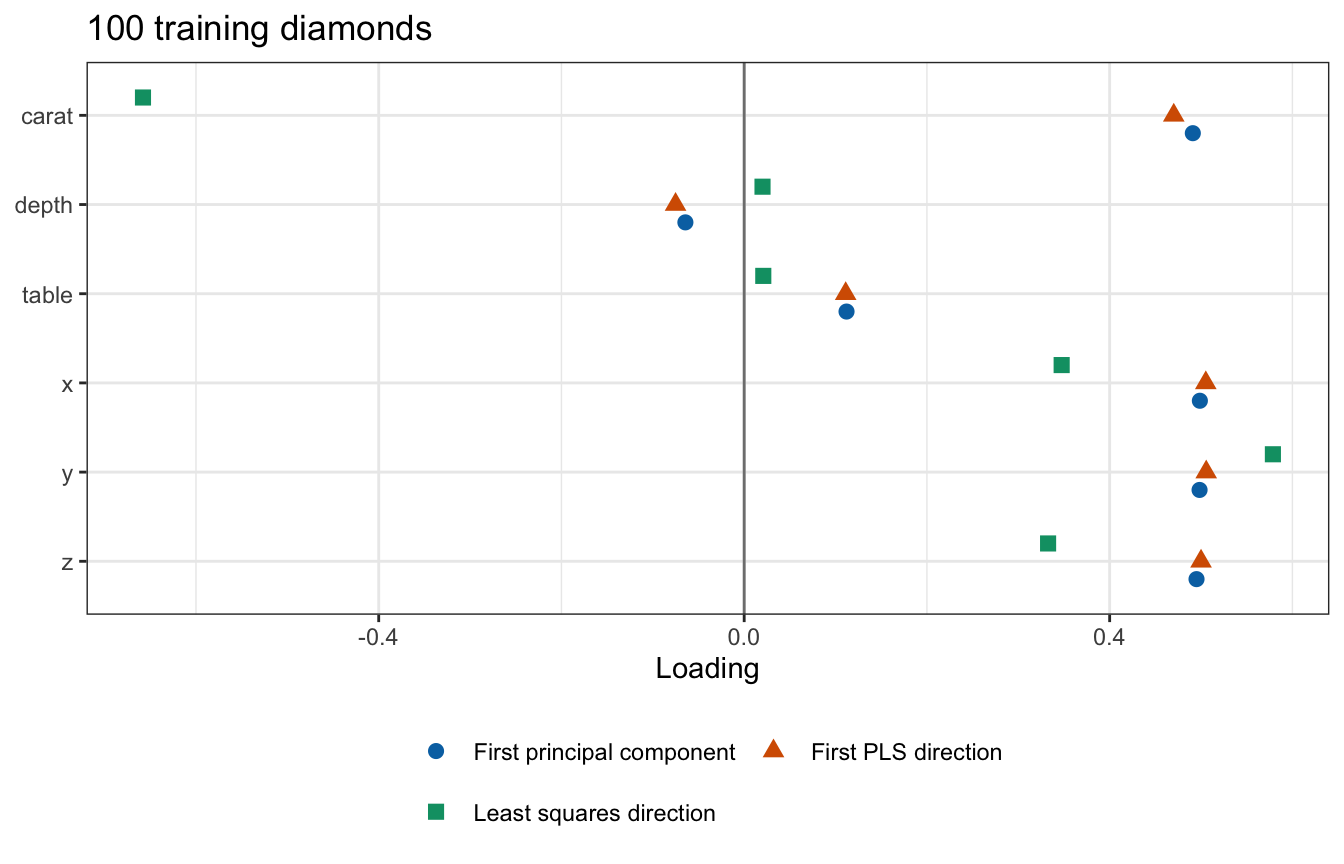
Criteria of three directions
| Direction | Variance of scores | Squared correlation with log price | Squared covariance with log price |
|---|---|---|---|
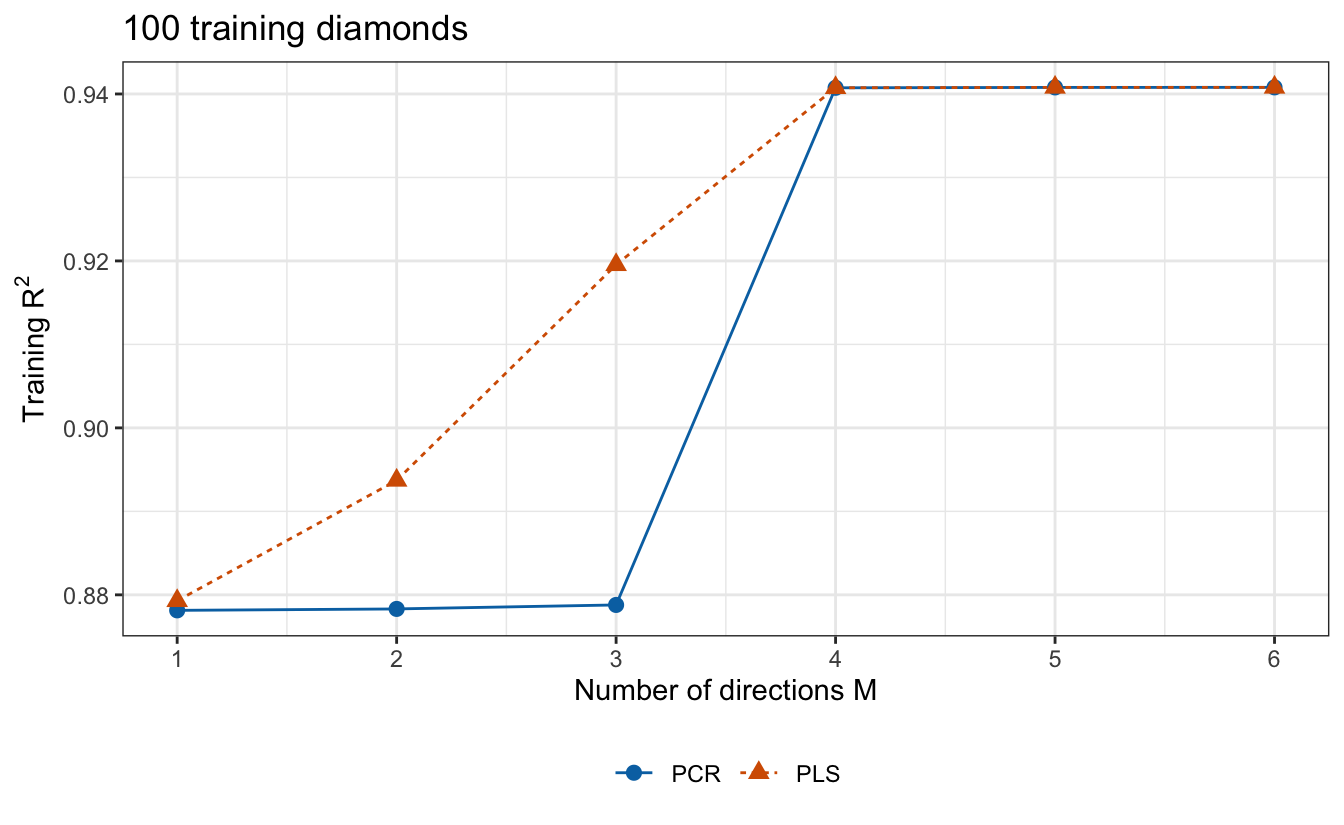
| First principal component | 4.001 | 0.8781 | 3.6687 |
| First PLS direction | 3.999 | 0.8793 | 3.6712 |
| Least squares direction | 0.397 | 0.9408 | 0.3900 |
Later directions
\[\tilde{\mathbf{x}}^{(2)}_{\cdot j} = \tilde{\mathbf{x}}_{\cdot j} - \frac{\left(z^{\text{PLS}}_1\right)^\top\tilde{\mathbf{x}}_{\cdot j}}{\left(z^{\text{PLS}}_1\right)^\top z^{\text{PLS}}_1}\,z^{\text{PLS}}_1\]
- \(\tilde{\mathbf{x}}_{\cdot j}\) — column \(j\) of \(\tilde{\mathbf{X}}\), feature \(j\) over the training diamonds
- \(\tilde{\mathbf{x}}^{(2)}_{\cdot j}\) — residuals of column \(j\) regressed on \(z^{\text{PLS}}_1\)
\[\phi^{\text{PLS}}_2 \propto \left(\tilde{\mathbf{X}}^{(2)}\right)^\top\left(y - \bar y\mathbf{1}\right), \qquad z^{\text{PLS}}_2 = \tilde{\mathbf{X}}^{(2)}\phi^{\text{PLS}}_2\]
- The scores are uncorrelated
- PLS is a linear model in the features
- \(M = p\) is least squares
Directions compared
Directions kept
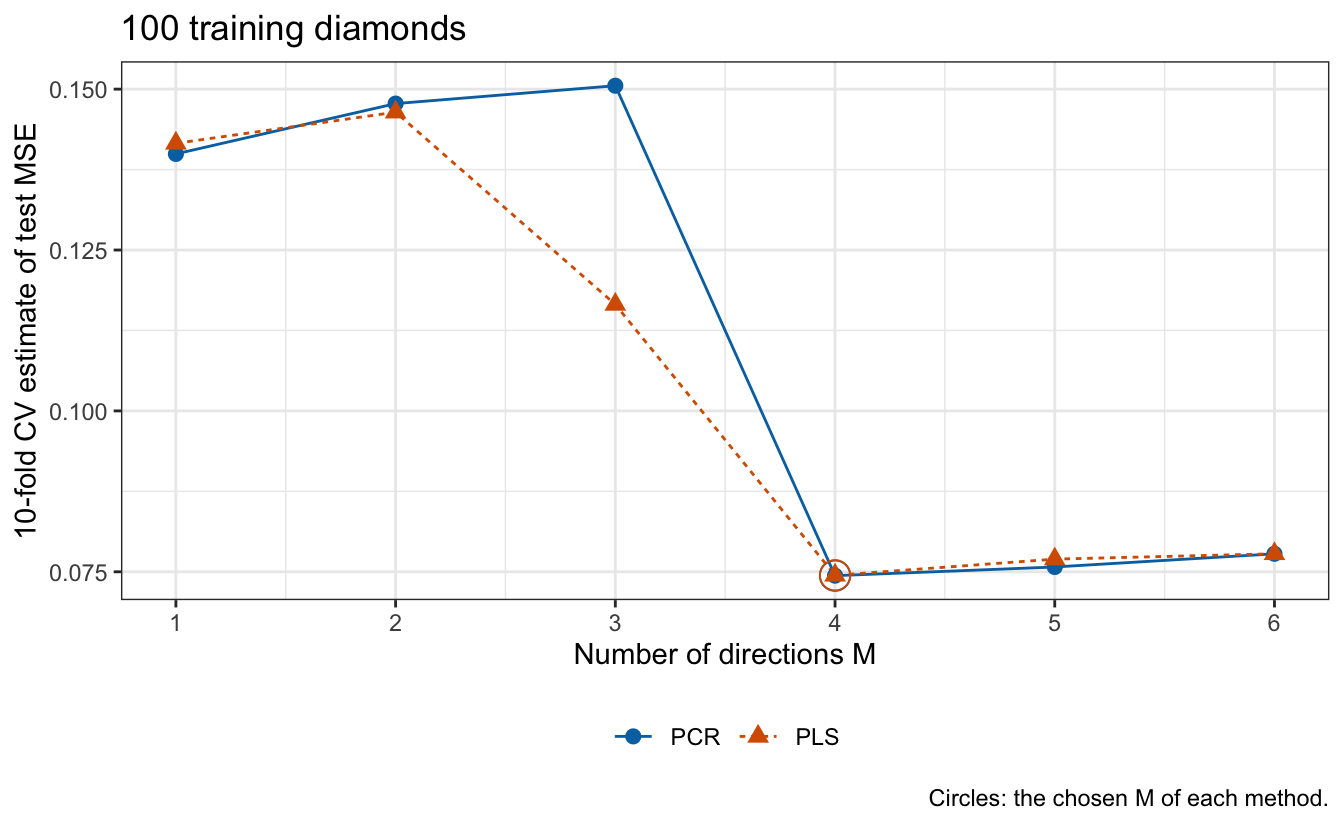
Test MSE
| Method | \(M\) | Training MSE | 10-fold CV estimate | Test MSE |
|---|---|---|---|---|
| Least squares | 6 | 0.0618 | 0.0778 | 0.0726 |
| PCR | 4 | 0.0619 | 0.0744 | 0.0727 |
| PLS | 4 | 0.0619 | 0.0745 | 0.0727 |
Conclusion
- Dimension reduction regresses on \(M < p\) directions
- PCR keeps or drops components; ridge regression shrinks them all
- PLS uses the response: it can lower bias but can add variance
- Recompute the directions in each cross-validation fold
- Neither method selects variables
DS 3030